Download PDF
Investor Presentation · Seed Round

From Industrial Commerce to AI-Powered Supply Chain Execution

An 11-year trade network → a live platform → an AI execution network. On top of real industrial trade, we add AI that links factory production and purchasing data to the deal.

Seed Round$500K – $1M
Since 2015B2B trade in Southeast Asia
BangkokPlatform live in Thailand
Marketplace liveREINDEERS.AI paid from Dec 2026
Investment thesis

A real industrial commerce business, expanding into AI-powered supply-chain execution

We built the platform on an 11-year industrial supply business; now we extend it into AI that runs factories and supply chains.

01
11-year network
500+
Cumulative B2B buyers · trading and logistics from Bangkok since 2015
02
Platform built & live
2 products
Marketplace live since Feb 2026 · REINDEERS.AI paid from Dec 2026
03
Real revenue
~$181K
GMV Feb–Sep 2026 · 35% gross margin, actual
04
Break-even in sight
≈$47K
Monthly revenue to break even · expected Nov 2026
What this round proves: repeatable new-customer acquisition and paid conversion of REINDEERS.AI.
GMV and gross margin: platform actuals (slide 5) · break-even = $15K fixed cost/month ÷ (35% − 3% logistics) · definitions: Appendix A902 / 15
Problem · The dealer trap

Southeast Asian Factories Are Stuck in a Dealer Market

Industrial materials still move through layers of dealers, email and spreadsheets. The buying company pays for every layer — in price, time and risk.

<5%
DX gap
Companies with digital systems for orders, quotes and logistics
<1%
AX gap
AI use in procurement and supply-chain decisions
30%+
Delayed trades
Held up by document errors and manual work
Layered dealer markups
Regional dealers add 30%+; imported goods 50%+
→ Pays far above source price, with no price transparency
Manual, disconnected work
Quotes, documents and logistics by email and Excel; trade, logistics and ERP run separately
→ 2–3 days per quote; no supply-chain visibility
Customs barriers
HS code misclassification and TISI certification handled by hand
→ Shipment delays and penalties
DX / AX adoption, delayed-trade share and dealer margins are REINDEERS estimates from field operations in Southeast Asia since 2015, not third-party statistics03 / 15
Solution

2 Products · 1 Industrial Data Loop

REINDEERS Marketplace captures industrial demand. REINDEERS.AI turns that demand into production and procurement decisions. Factory data flows back into pricing, availability and lead times — a closed-loop industrial commerce network.

PRODUCT 01 · TRADE REINDEERS Marketplace Captures industrial demand · Quotes, orders and payment · Trade documents and customs · Forwarding, warehousing, delivery · 1P + 3P industrial supply Buyer · Supplier · Forwarder · 3PL Live PRODUCT 02 · FACTORY REINDEERS.AI Turns demand into production and procurement · AI production planning · Material requirements & procurement · Inventory & production execution · Delivery planning Manufacturers · producers Beta in preparation · paid from Dec 2026 DEMAND RFQs · Orders Delivery dates · Forecasts SUPPLY INTELLIGENCE Inventory · Capacity Cost · Lead times
Marketplace alone
Commerce
AI MES alone
SaaS
Marketplace + AI MES
A proprietary demand / supply data loop
Closed-Loop Industrial Data · Demand ↔ Supply Execution04 / 15
Traction · Feb – Sep 2026 actual · Oct – Dec forecast

~$181K GMV in Feb–Sep 2026, 63% repeat purchase

Live in Thailand since Feb 2026. Monthly GMV to date and the Oct–Dec outlook.

Cumulative GMV · Feb–Sep 2026
~$181K
Feb–Aug includes purchases by iMarket, the founder's existing trading company (related party)
Buying customers in Sep
13
~80% former iMarket customers, the rest new
Repeat purchase
63%
17 of 27 external buyers bought in 2+ months (Feb–Sep)
Monthly GMV + SaaS revenue · USD K
1P 3P SaaS Forecast
40 80 120 0 3.2 Feb 9.4 Mar 36.8 Apr 36.7 May 23.1 Jun 8.3 Jul 28.8 Aug 35.1 Sep 40 Oct 60 Nov 120 +4.2 Dec AUG · 1P FORECAST →
500+
customers
→
60+
registered
→
30+
active
→
13
buying in Sep
Aug 2026: the founder's trading company (iMarket) moved its business onto REINDEERS as 1P · Sep: 100% 1P
Platform reindeers.co.th · Feb – Sep 2026 actual, Oct – Dec forecast · USD at 33 THB/USD · scope and definitions: Appendix A905 / 15
Market · starting in Thailand

Start with Thailand MRO ≈ $9B, expand to Southeast Asia >$58B

ASEAN factories need materials, parts and MRO supplies every day — and still buy them by phone, email and spreadsheet.

Beachhead · Thailand MRO · 2029
REINDEERS estimate
≈ $9B
SEA MRO market × Thailand's 16% share of ASEAN manufacturing · calculation: Appendix A1
Our home market, where we have traded since 2015
→
Expansion · Southeast Asia MRO · 2029
>$58B
Growing 7%+ a year (PSS Insight)
Thailand is the base for expansion across ASEAN
Context only · not market size
$804B
ASEAN-10 manufacturing value added, 2024 — Shows the size of the manufacturing base that buys industrial supplies (Thailand $128B, 16%). It is not REINDEERS' market size (TAM).
Sources: KrASIA, 15 Jul 2026, citing PSS Insight (SEA MRO) · World Bank NV.IND.MANF.CD, 2024 · Thailand MRO = REINDEERS estimate06 / 15
Product 01 · REINDEERS Marketplace · Built · live since Feb 2026

One Platform for the Entire Industrial Transaction

REINDEERS controls the whole flow — from RFQ and sourcing to customs and final delivery — and earns on both 1P trade and 3P marketplace transactions.

Buyer
Requests quotes, orders and receives goods
Supplier
Quotes, confirms and fulfills supply
Forwarder
Handles international freight and customs
3PL
Warehouses, picks and delivers locally
STEP 1 Source & Quote RFQ · supplier quotes · comparison STEP 2 Order & Pay PO · payment · confirmation STEP 3 Trade & Customs CI · PL · B/L · HS code · customs STEP 4 Fulfillment Warehouse · delivery · POD
How we earn
1P trade
REINDEERS buys and sells. GMV is revenue; 35% gross margin (actual, Aug–Sep 2026).
+ Private Label · extension of 1P
OEM-made REINDEERS products for fast-moving items
3P marketplace
Suppliers sell directly; REINDEERS earns a commission.
REINDEERS Marketplace · reindeers.co.th07 / 15
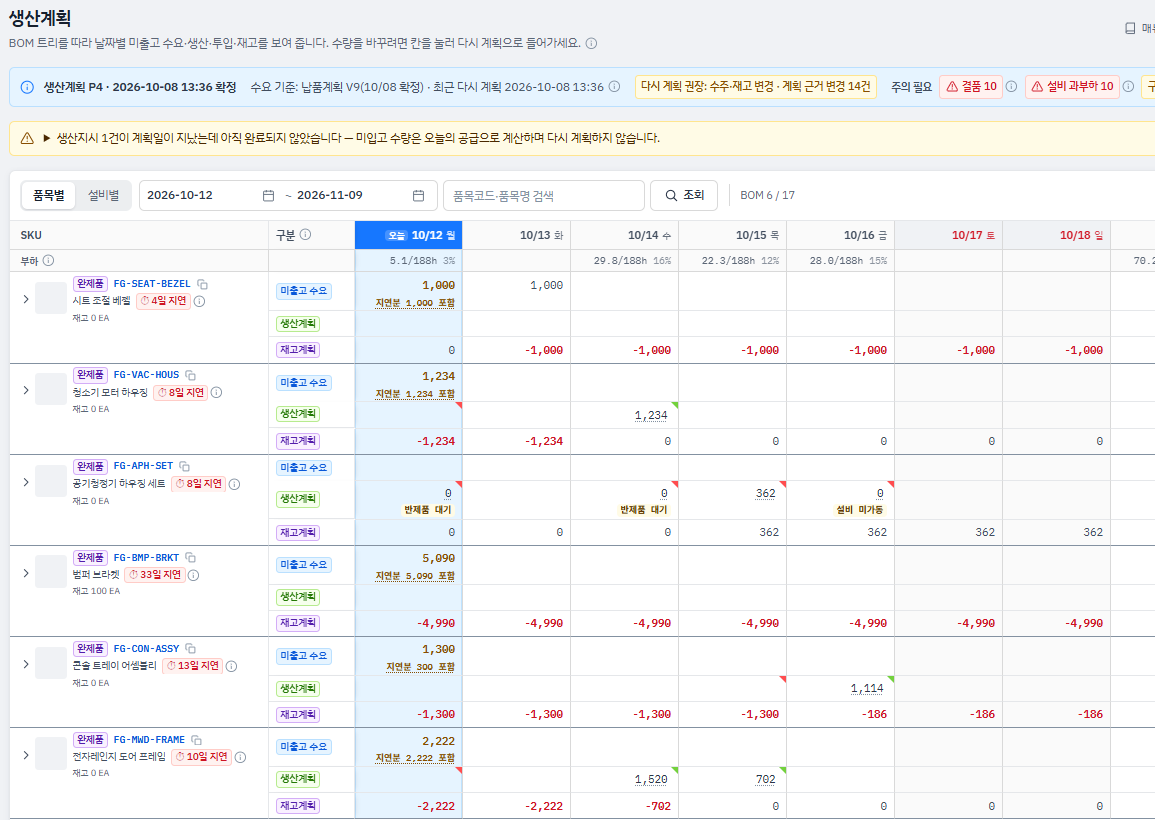
Product 02 · REINDEERS.AI · AI MES / ERP / WMS

The factory execution layer: from PO to real-time output

When a customer PO arrives, AI builds the delivery, production, material and machine plans; once a planner approves, it executes.

Input
AI decision
Auto-execution
Real-time
01
Delivery plan
Auto-built from incoming customer POs
02
AI production planning (APS)
Order-driven, per item
03
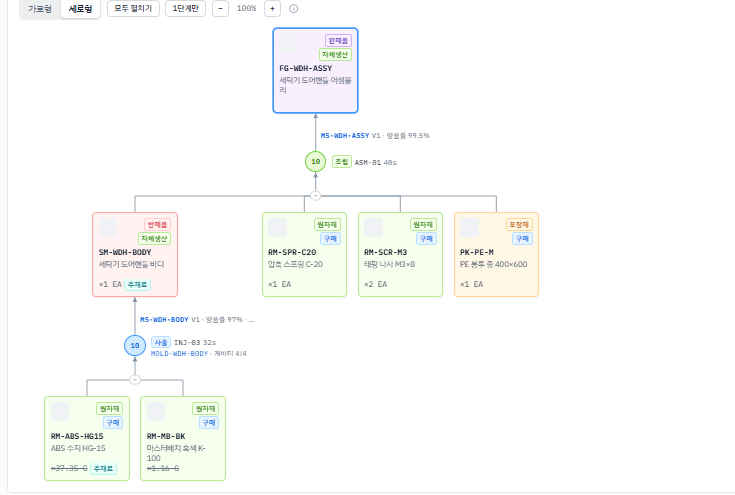
Multi-level BOM explosion
Production-spec analysis: moulds · machines · process
04
Machine allocation + release orders
Raw-material and mould release orders, issued automatically and simultaneously
05
Real-time output tracking
Via shop-floor IoT
REINDEERS.AI
1Production planAPS auto-calculated
REINDEERS.AI BOM
2BOMProduct → materials · moulds
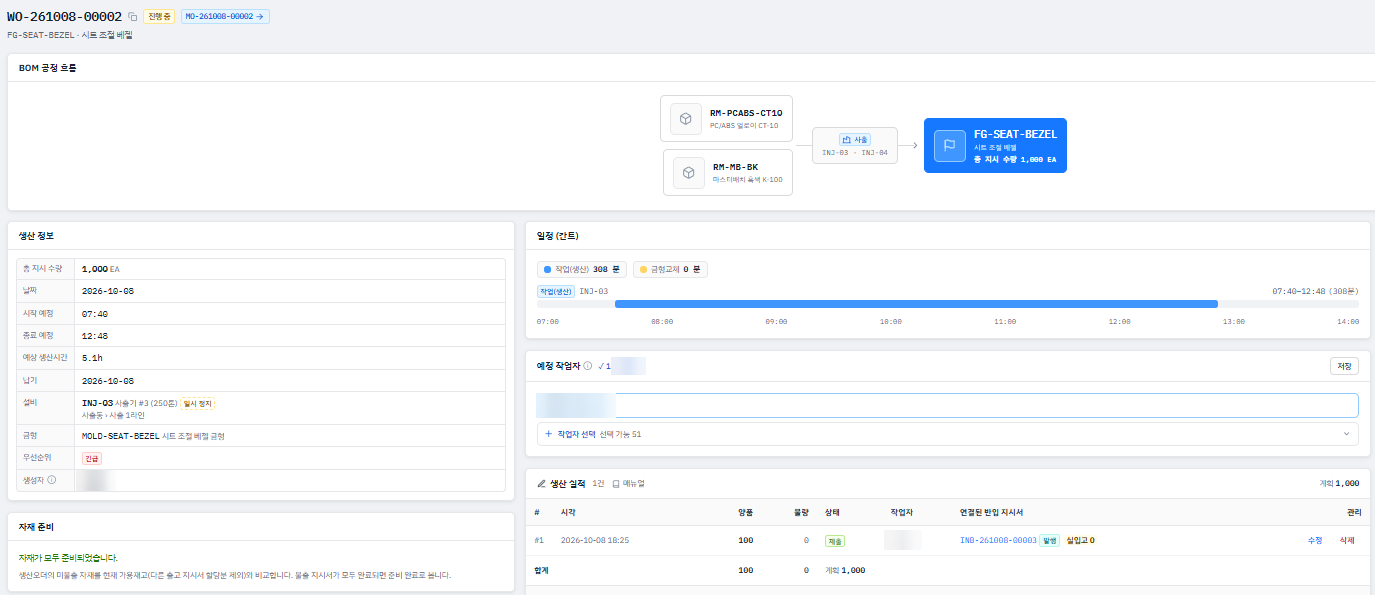
REINDEERS.AI work orders
3Work ordersAuto-scheduled
StatusBeta in preparation · 5 demo factories confirmed · paid from Dec 2026
$1,000 / month · $10,000 / year
Actual REINDEERS.AI screens, Oct 2026 · customer, staff and tenant names masked08 / 15
REINDEERS AI · End-to-end automation

End-to-end: one order, executed by AI

One example order from request to delivery. Key approval points: customer approval and final shipment.

EXAMPLE · CUSTOMER REQUEST“Bumper brackets, 5,000 units, within 3 weeks”
Marketplace
Factory · REINDEERS.AI
Trade · delivery
01
Supplier matching
AI matches 3 qualified suppliers
AI
02
Quote · PO
AI generates the quote and the PO
AI
03
Customer approves
The customer checks and approves
👤 Human approval
04
Production plan
Factory AI: APS, BOM explosion, machine allocation
AI
05
Real-time output
Shop-floor IoT captures output in real time
AI
06
Trade documents
AI classifies the HS code and generates trade documents
AI
07
Confirmed → delivered
Final human approval, then shipment
👤 Human approval
Marketplace + factory AI: one end-to-end flow
AI👤 Human approval
Illustrative example, not a real customer order · combines the Marketplace flow (slide 7) and the factory flow (slide 8)09 / 15
Competitive advantage

Our edge is not one feature — it is connected execution

Alibaba.com offers RFQ and Amazon Business offers procurement-system integration. REINDEERS runs the whole local Thai trade in one operating system.

One operating system
01
Local sourcing
Thai · Chinese · Korean suppliers
02
Customs
HS codes · certification · trade documents
03
Logistics
Forwarders · 3PL · delivery
04
Factory production data
REINDEERS.AI · POs · BOMs
05
Purchase execution
Quote → order → delivery
11-year network
500+ · 1,800+
Cumulative buyers · suppliers (China · Korea · ASEAN)
Industrial knowledge base
4-country HS DB
67K HS codes · 517K tariff rates · 18K HS code–certification mappings
AI agents in operation
1,100+
AI supplier matching runs · automated quotes and trade documents (Match · Doc engines)
Competitor features per their public materials · data assets counted on the REINDEERS platform on 12 Oct 2026, detail: Appendix A210 / 15
Business model · unit economics

1P is the base, 3P scales on top — both grow

Annual 1P revenue · 3P GMV · USD M
1P revenue3P GMV
0.26 0.14 2026 4.25 0.86 2027 3P share 20% 10.8 5.1 2028 3P share 40% 15.7 15.0 2029 3P share 55% 19.8 30.6 2030 3P share 65%
Why 1P is strategic
Customer acquisitionFirst-party trade turns the 500+ network into platform buyers
35% gross marginThe margin from cutting out dealer layers · actual, Aug–Sep 2026
Channel to 3P sellersSuppliers whose goods sell through 1P become 3P sellers
Gross margin
35%
Revenue − cost of goods · actual, Aug–Sep 2026
Gross profit per PO
~$250
Average PO ~$716 · Sep 2026
Break-even revenue
≈$47K
$15K fixed cost ÷ (35% − 3% logistics)
3P take rate
6.9%
Actual, Feb–Jul 2026
SaaS
$833 /mo
REINDEERS.AI annual plan
1P revenue and 3P GMV are projections (Appendix A6) · 3P share = 3P part of year-end GMV · gross margin is a management actual (Appendix A9)11 / 15
Go-to-market

10 new buying customers a month from the 500+ network

First we convert our 11-year network into platform buyers; from 2027 H2 we add new channels.

Buying customers
13 Sep 2026 actual ~43 Dec 2026 plan ~70 Jun 2027 plan 136 Dec 2027 plan
Oct – Dec 2026
Convert the 500+ network · +10 a month
→ ~43 buying customers in Dec
2027 H1
Keep converting the network
→ ~70 in Jun
2027 H2
New channels: local sales · buyers brought by 3P sellers
→ 136 in Dec · ~25% of the 500-company network
REINDEERS.AI
5 demo factories → paid from Dec 2026
→ 16 subscribers in Dec 2027
Buying customers = customers with a delivered order in the month · Sep 2026 actual, later months plan · 2027 plan: Appendix A612 / 15
Team · Co-founders

We've Built This Before 5 co-founders · all full-time

Five full-time co-founders: a founder with 20+ years on the ground in Thailand, three NHN Accommate leaders who built Korea–China cross-border commerce, and a Southeast Asian logistics operator. Backed by a 6-person operations team in Bangkok.

Kim Myung-hoon
Founder & CEO
Kim Myung-hoon
Management support lead, Samsung Electronics Thailand
20+ yrs in Thailand · 11 yrs running his own B2B supply business
Park Jun-young
CSO
Park Jun-young
CTO, NHN Accommate
20+ yrs commerce & logistics strategy · AI strategy
Jin Chengji
CPO
Jin Chengji
Division Head, NHN Accommate
20+ yrs B2B SaaS product · logistics workflow design
Zhou Qirong
CTO
Zhou Qirong
Team Lead, NHN Accommate
15+ yrs · AI · LLM · RAG · distributed systems
Zhang Wei
CMO
Zhang Wei
8+ yrs SEA logistics operations
SEA network · 3PL and customs operations
$231M
Annual revenue operated at NHN (KRW 300B)
$11.5M
Investment into NHN Entertainment, led (KRW 15B)
200+
Korean brands taken into China
USD at KRW 1,300 / USD · All five are full-time co-founders13 / 15
Financial roadmap · next 12–24 months

Break-even in Nov 2026, $300K monthly 1P revenue by Jun 2027

Monthly GMV · USD K · Oct 2026 – Dec 2027
1P3P👥 buying customers
40 Oct 60 Nov 120 👥 43 Dec Jan Feb Mar Apr May 353 👥 70 Jun Jul Aug Sep Oct Nov 867 👥 136 Dec 2026 2027 Break-even ≈ Nov
Monthly 1P revenue
$300K
Reached in Jun 2027 → then +15%/month · ~$694K in Dec 2027
Buying customers
13 → 43 → 70 → 136
Sep 2026 → Dec 2026 → Jun 2027 → Dec 2027
Working capital
Customer credit · 45 days on average
Supplier terms · 15–30 days · being extended
→ net working capital ≈ 1× monthly revenue · at $300K/month ≈ $255–350K + PB inventory (90 days) ≈ $200K
Plan, not actuals · GMV = 1P revenue + 3P GMV · full 5-year table and assumptions: Appendix A6 · USD at 33 THB/USD14 / 15
Investment ask · vision
Seed round
$500K – $1M
Break-even: ≈ $47K monthly revenue ($15K fixed cost ÷ 32%) · expected Nov 2026
Allocation · $500K – $1M
60%
PB inventory$300K – $600K
40%
Reserve · sales · customer acquisition$200K – $400K
PB inventory covers fast-moving items only, 90 days · new items ordered after customer agreement
What this round proves
01
Repeatable new-customer acquisition+10 a month · ~70 by Jun 2027
02
REINDEERS.AI paid conversion5 demo factories → paid subscriptions
03
1P margin & working-capital efficiency35% gross margin held · net working capital ≈ 1× monthly revenue
04
First 3P sellers1P suppliers converted to 3P sellers
ChatGPT gives answers. REINDEERS executes.
Make 100,000 units to our spec and ship them to Thailand within 6 weeks.
REINDEERS · CEO Myunghun Kim · hun@reindeers.com
Vision · illustrative interface15 / 15
Appendix · Market · Thailand

Thailand: Where We Start — and Already Operate

ASEAN's second-largest manufacturing economy, where a quarter of GDP comes from factories — and where REINDEERS has run B2B trade since 2015.

Manufacturing value added
$128.3B
Thailand, 2024 (World Bank)
Share of GDP
24.3%
Manufacturing as % of Thailand's GDP, 2024 (World Bank)
Share of ASEAN manufacturing
16%
$128.3B of the $804B ASEAN-10 total, 2024
SEA MRO MARKET · 2029 >$58B PSS Insight via KrASIA 7%+ annual growth × 16% THAILAND MRO MARKET · 2029 REINDEERS ESTIMATE ≈ $9B SEA MRO market ($58B) × Thailand's share of ASEAN manufacturing value added (16%). Our home market — and the base for expansion across ASEAN.
Sources: World Bank, NV.IND.MANF.CD and manufacturing % of GDP, 2024 · KrASIA, 15 Jul 2026, citing PSS Insight · Thailand MRO = REINDEERS estimate, not a third-party figureA1
Appendix · REINDEERS AI · AI stack

Vertical AI for industrial trade: 4 AI agents in production

Multi-agent orchestration across the whole trade, from supplier matching to factory execution. Match and Doc engines run on the Marketplace; Ops and Planning engines ship in the REINDEERS.AI beta.

LIVE
Match
Match Engine
AI supplier matching for every RFQ, trained on proprietary trade data
LIVE
Generate
Doc Engine
Quotes, POs and trade documents, verified before issue
Beta
Execute
Ops Engine
Machine allocation and automated release orders
Beta
Plan
Planning Engine
APS production planning and multi-level BOM explosion
Shared learning backbone
RAG · event-sourced data · closed-loop learning: every deal feeds back into the models
Hybrid AI = proprietary data + RAG + fine-tuned models + frontier LLMs
Proprietary Data
25K+Deals since 2015, incl. offline
15KListed SKUs
1,100+AI supplier-matching runs
BetaFactory execution data · 5 demo factories (REINDEERS.AI)
Industrial Knowledge Base
67KHS codes · 4 countries (TH · KR · CN · HK)
517KTariff rates · 3 countries (TH · KR · CN)
18KHS code–certification requirement mappings
Data assets counted on the REINDEERS platform on 12 Oct 2026, rounded down · deals = verified trades since 2015, incl. offlineA2
Appendix · REINDEERS AI · Trust and verification

Deterministic Validation + Human Approval

In trade, one wrong figure can stop a shipment. Three design principles of the live AI:

1
Every figure is computed by a deterministic verification engine — zero AI-estimated numbers
2
Every AI action passes 3-layer verification
3
Human-in-the-loop approval on every critical decision
Event-sourced audit trail for every AI decisionA3
Appendix · REINDEERS AI · Data flywheel

Data flywheel: every deal makes the models sharper

Today, industrial trade is manual and no data is captured. On REINDEERS, every transaction is recorded and feeds the models.

AS-IS · TODAY
  • Suppliers found by hand
  • Quote requests written in Excel
  • Answers by messenger and email
  • Quotes compared by hand
  • Production planned separately
Nothing is recorded. Every trade starts from zero.
TO-BE · REINDEERS
  • One request
  • AI matching → quote → order
  • → production plan → documents
Every step is recorded and trains the next trade.
REINDEERS DATA FLYWHEEL 1 Transaction 2 Data capture 3 Model learning 4 Higher accuracy 5 More deals Vertical LLM for industrial materials
Transaction → Data capture → Model learning → Higher accuracy → More deals → Vertical LLMA4
Appendix · REINDEERS AI · KPI

AI Performance Targets (R&D) All figures on this slide are R&D targets

Each target is benchmarked against the global leader.

KPICurrent level in KoreaR&D targetWorld level
Match Precision@1040–55%→75%+ R&D target80%+ · Alibaba
Document Numerical Accuracy92–96%→99%+ R&D target99.95%+ · Google
AI Action Pass Rate—→95%+ R&D target92–96%
Work Order Accuracy70–80% (manual)→98%+ R&D target98–99% · SAP
Third-party verification by a KOLAS-accredited lab (Korea Laboratory Accreditation Scheme)
R&D targets, not measured results · current level in Korea = domestic baseline in REINDEERS' TIPS R&D plan (2026), not our own measurement · world level from the same planA5
Appendix · 5-year projection · USD

5-Year Projection: $23.0M Revenue and 29% EBITDA in 2030

 20262027202820292030
Total GMV0.40M5.11M16.0M30.7M50.4M
1P revenue0.26M4.25M10.8M15.7M19.8M
3P GMV0.14M0.86M5.1M15.0M30.6M
3P commission0.01M0.06M0.35M1.04M2.11M
SaaS revenue0.004M0.10M0.27M0.59M1.11M
Total revenue0.27M4.41M11.5M17.3M23.0M
Gross profit (margin)–1.63M (37%)4.36M (38%)7.00M (40%)9.92M (43%)
People & overhead–0.28M1.61M2.08M2.53M
Logistics (3% of revenue)–0.13M0.34M0.52M0.69M
EBITDA (margin)Q4 +0.02M1.22M (28%)2.41M (21%)4.40M (25%)6.70M (29%)
REINDEERS.AI subscribers (Dec)5164080143
2026: Feb–Sep actuals; GMV Oct $40K, Nov $60K, Dec $120K; 1P share 95% / 95% / 90%.
1P gross margin 35% (actual Aug–Sep 2026); 3P take rate 6.9% (actual Feb–Jul); SaaS $833/month, 20% hosting/AI cost.
2027: 1P revenue reaches $300K/month in Jun 2027, then +15%/month; GMV mix 1P:3P = 80:20 by Dec 2027.
Subscribers: 5 from Dec 2026 (demo factories converting to paid), +10%/month in 2027; +8% / 6% / 5% per month 2028–2030.
2028–2030: 1P monthly growth 4% / 2.5% / 1.5%; 3P share of GMV 40% / 55% / 65% (year-end).
People & overhead: $15K/month now, ramping from Dec 2026 to a $25K/month cap through 2027; then 14% / 12% / 11% of revenue. Logistics 3% of revenue.
Working capital: customer credit 45 days, supplier terms 15–30 days · PB stock only (30–40% of 1P), 90 days.
Benchmarks FY2024: Grainger GM 39.4%, op. margin 15.4% · MonotaRO GM 29.3%, op. margin 12.9%.
Projection, not guaranteed results · 2026 = Feb–Sep actual + Oct–Dec forecast · USD at 33 THB/USDA6
Appendix · Built for these problems

Today vs With REINDEERS

Every chronic problem of the dealer market maps to something we have already built — first digitise the trade, then let AI run it.

Work areaToday · dealer marketWith REINDEERSImpact
Purchase priceDealer markups of 30%+ (imports 50%+)~7% cheaper than customers' previous dealers — with margin to spare−7% price
Quotes2–3 days of manual comparisonAI compares supplier quotesAI auto‑suggestion
HS codeClassified by hand · frequent errorsAI suggests the HS code · a person confirmsAI auto‑suggestion
Logistics costForwarders asked one by one · 1–2 daysForwarder bidding · real-time comparison15–20% lower
InventoryManual Excel entry · no real-time viewREINDEERS.AI live stock · automatic alertsReal-time
Trade documentsHalf a day per shipment (CI · PL · B/L)Generated on the platform80% less time
WorkflowEmail and phone · no trackingOne workflow · end-to-end trackingAutomated
No AI without digital, no digital without data. REINDEERS digitises the trade first (DX), then automates it with AI (AX) — on 11 years of field data.
Purchase price: average vs customers' previous dealer prices (REINDEERS data) · other impact figures are REINDEERS estimates from its own operationsA7
Appendix · Network · since launch (Feb – Sep 2026)

A Working Network — Bigger Than Our Supplier List

Active = registered and doing business on the platform: requesting or answering quotes, or completing orders. Most active buyers already order; supply runs wider than the registered list.

Buyers
88% of active buyers ordered
Registered
60 Active
32 Ordered
28
Suppliers
75% of active suppliers sold
Registered
161 Active
20 Sold
15
Why the supplier list looks small
Our supply reach is bigger than our supplier list.
Thailand runs on dealers
Industrial supply still moves through traditional dealer networks, not online platforms.
"Sell it for us first"
REINDEERS is still a new name. Many suppliers start by having us sell their goods — and plan to register later.
1P today, 3P sellers tomorrow
Since Aug 2026 we sell those goods as 1P. Each supplier that sees its goods sell through us is a future 3P seller as the marketplace scales from 2028.
Platform reindeers.co.th · Feb – Sep 2026 · definitions of registered, active and ordered / sold: Appendix A9A8
Appendix · Data definitions

Data Definitions: Traction, Unit Economics and Network

The scope behind the figures on slide 5 (traction), slide 11 (unit economics) and Appendix A8 (network).

Source · periodPlatform reindeers.co.th · Feb – Sep 2026 actual, Oct – Dec forecast · Asia/Bangkok
GMV · revenueRecognised at delivery handover · excl. cancelled orders and the platform's own buyer account · goods only, excl. VAT, duty and freight, net of refunds
CurrencyUSD at 33 THB/USD, rounded
SaaS revenueREINDEERS.AI subscriptions at $833/month (annual plan), from Dec 2026
RegisteredApproved and enabled accounts on 5 Oct 2026, excl. REINDEERS' own (buyers: this platform; suppliers: all platforms)
ActiveRegistered accounts that requested or answered a quote / RFQ or had a delivered order, Feb – Sep 2026
Ordered / sold≥1 delivered order (same rules as GMV)
iMarket · externaliMarket = the founder's existing trading company (related party) · external customers = buyers other than iMarket and REINDEERS' own accounts
Repeat purchase17 of 27 external buyers (63%) bought in two or more distinct months, Feb – Sep 2026
Gross margin · PO35% = (revenue − cost of goods) ÷ revenue, 1P actual Aug – Sep 2026, management accounts · average PO = Sep 2026 GMV ÷ 49 POs ≈ $716
Break-even$15K fixed cost per month ÷ (35% gross margin − 3% logistics) ≈ $47K monthly revenue
REINDEERS platform data · definitionsA9
Appendix · The Shift

B2B Commerce Is Changing Generations

Gen 1 platforms were built for catalog ordering. Industrial trade is a different game — quotes, documents and four parties working together.

GENERATION 01 Catalog ordering Catalog-first B2B commerce Simple domestic orders Fixed prices · 2 parties Documents handled separately Email · Excel · human brokers AI as an assistant Recommendations and search only SHIFT GENERATION 02 Quote-based trade commerce REINDEERS Marketplace Domestic + cross-border trade in one flow Negotiated quotes · 4 parties (buyer · supplier · forwarder · 3PL) Documents built into the platform CI · PL · B/L · C/O · HS code generated automatically AI-native operations Quote matching · customs · payment · settlement
Most industrial trade in Southeast Asia still runs on people, email and spreadsheets. Gen 2 puts the whole trade — quote, documents, customs, delivery — on one platform, so the same team can handle many times the volume.
Gen 1 Catalog → Gen 2 Quote-Based TradeA10