
AI-powered B2B SaaS centered on the international trade platform (REINDEERS),
integrating logistics (DVRP) and POP (MES + ERP + WMS) through data connectivity

2026Thailand Platform Launch
$130BSEA B2B Market Size
HKTDC Research 2025
$108B+Industrial Materials TAM
Based on ASEAN manufacturing GDP
4,300+Cumulative Local Partners
6Integrated Platforms
HISTORY

From Business Validation to AI Tech Company

Phase 1 · Local Supply Chain Ops
2015—2021
Thailand operations launched. 2,500+ clients · 1,800+ suppliers · 25,000+ transactions.
1
2
Phase 2 · Incorporation & Tech Foundation
2022
Korea & Thailand entities · R&D center · Pre-Startup Package selected.
Phase 3 · Pivot to AI Tech Company
2023—2024
Malaysia entity · Venture enterprise certified · Supply chain patent registered.
3
4
Phase 4 · Global Expansion & AI Commercialization
2025—2026
China entity · AI service launched in Thailand · SEA expansion in progress.

Local Ops (2015) → Incorporation (2022) → AI Pivot (2023) → Global Expansion (2025~)

COMPANY OVERVIEW

REINDEERS Co., Ltd.

An AI-powered B2B SaaS platform company founded on 11 years of SEA trade & logistics operational experience.

Founded

Started in Thailand in 2015
11 years of trade & logistics field ops
Business model based on real data

Vision

Integrate international trade,
logistics & POP into a single
AI-powered platform to remove barriers

Mission

Solve structural inefficiency
and information asymmetry in
B2B supply chains with AI decision engine

Strength

11+ years SEA field experience
2,500+ clients · 1,800+ suppliers
4-country entities · proven tech team

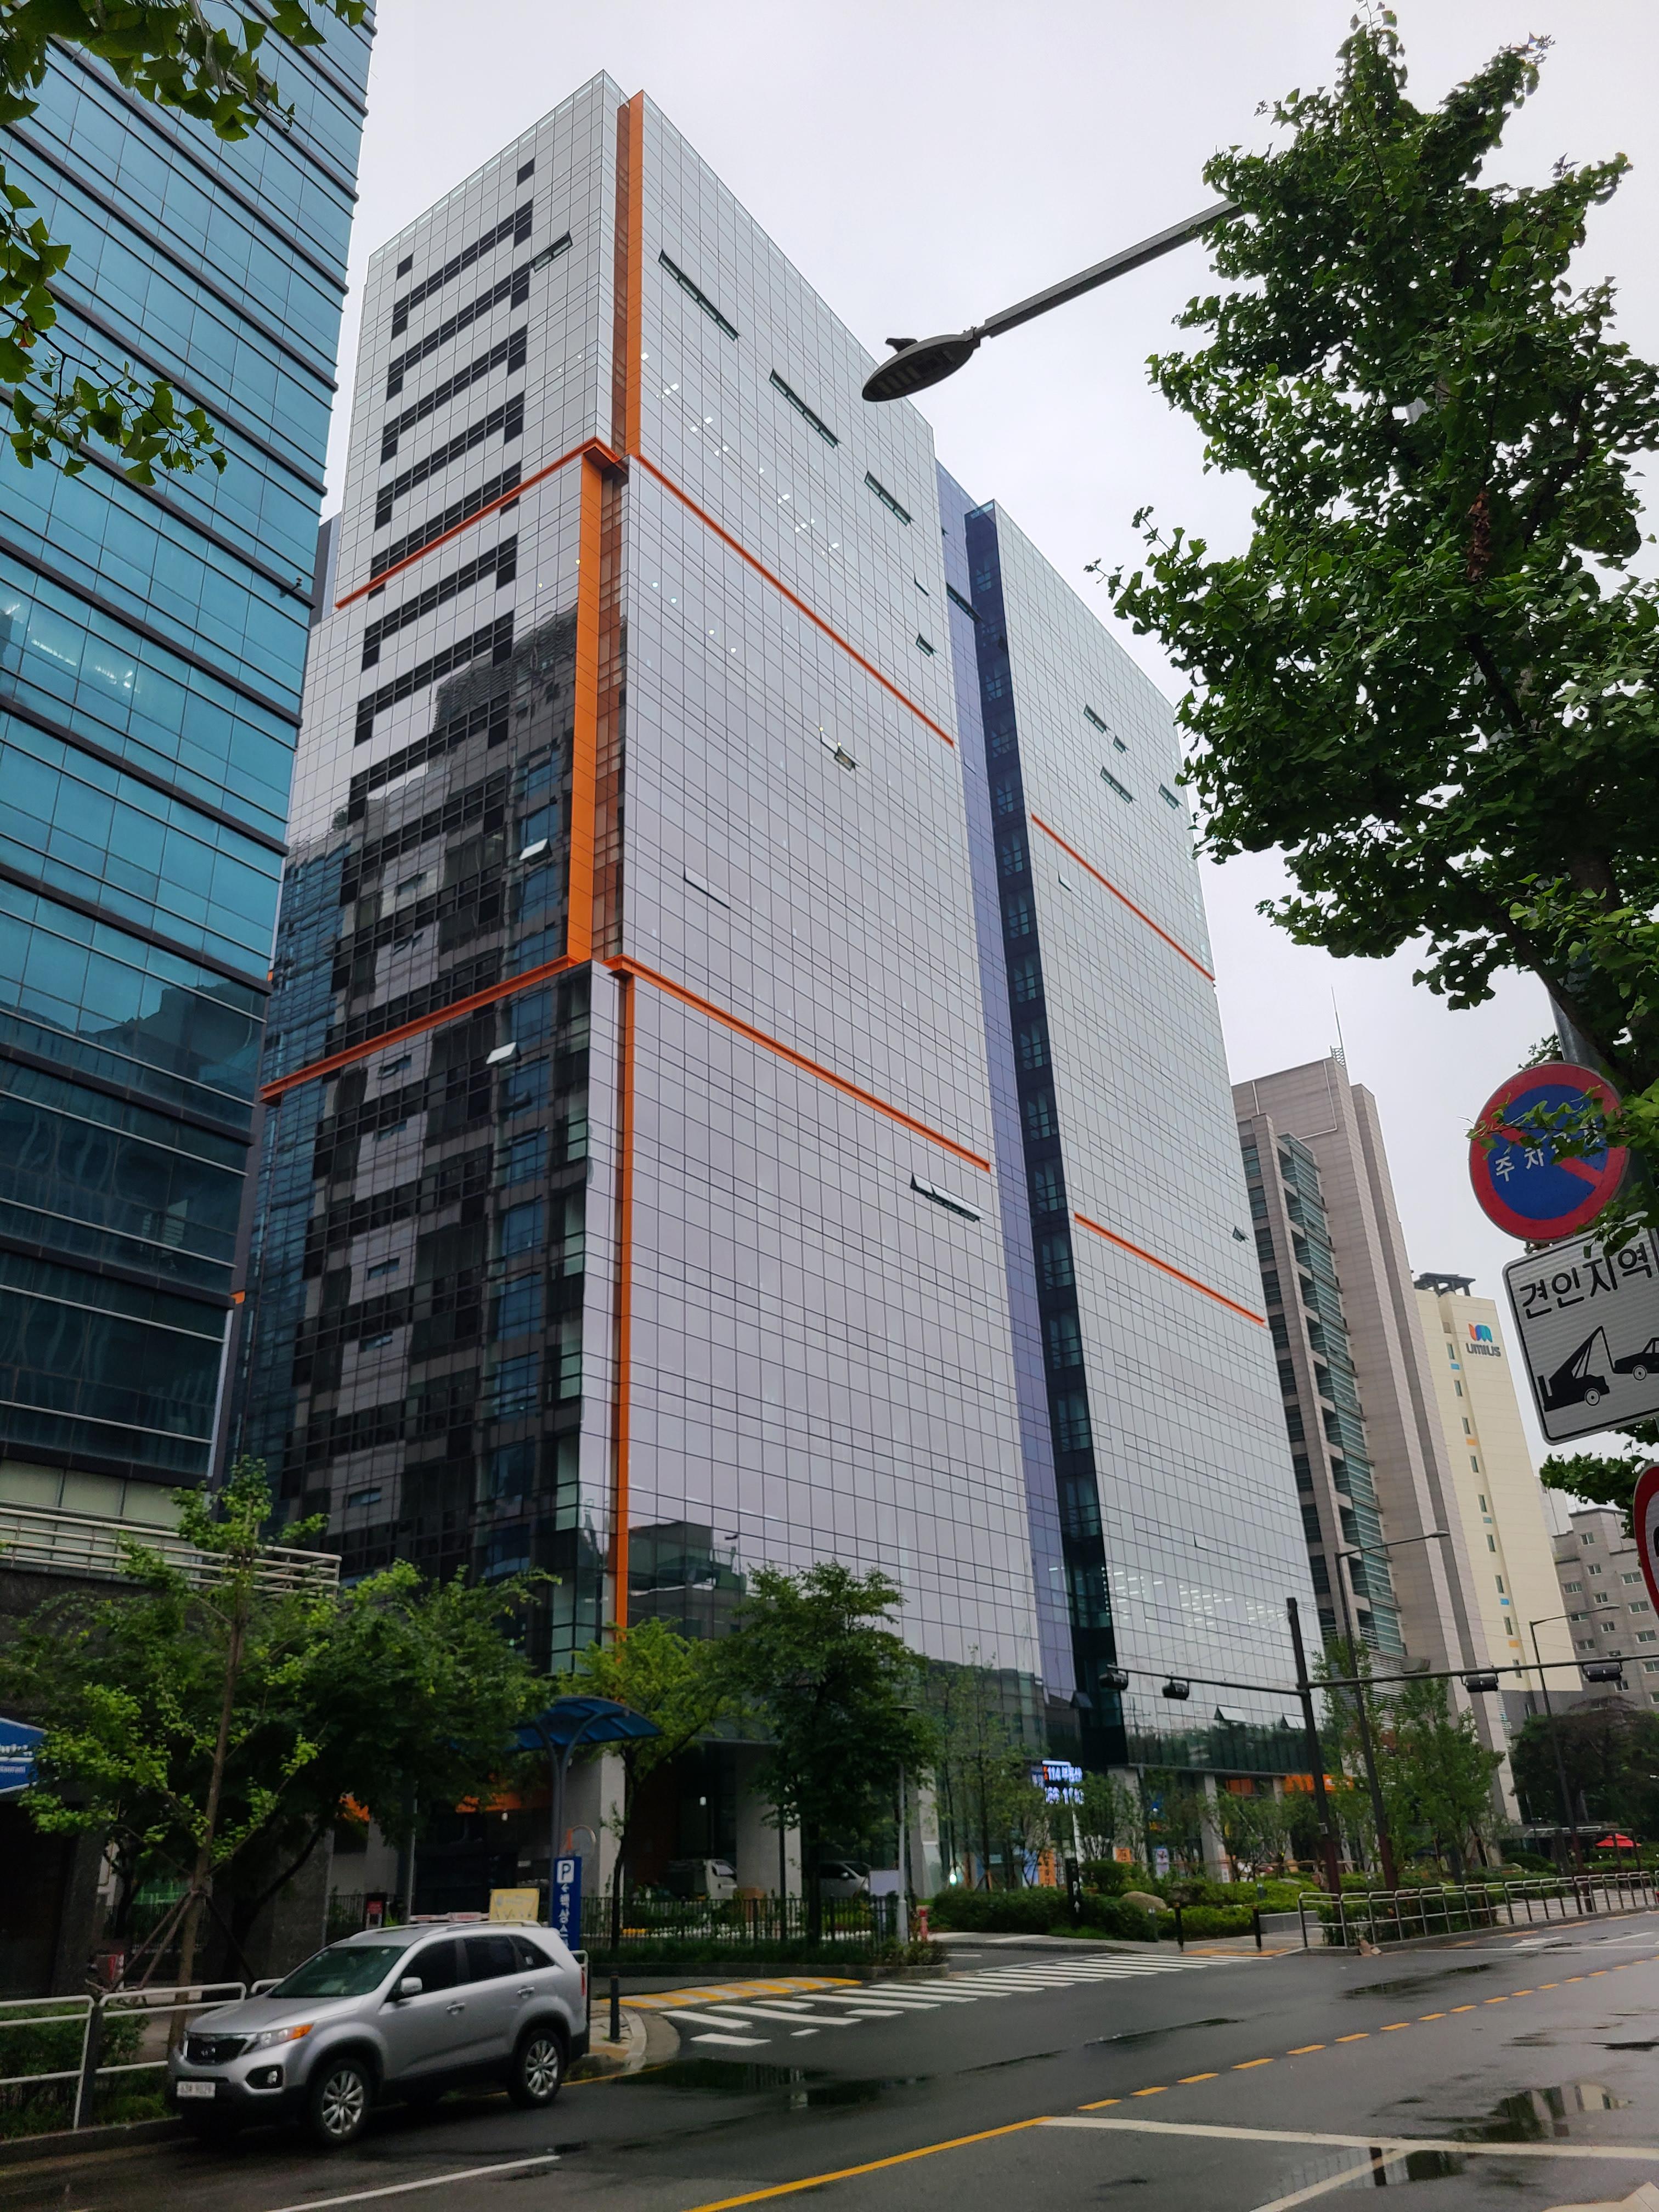
CORPORATE BRANCH

CountryEntity NameAbbr.Location
Korea (HQ)REINDEERS Co., Ltd.REINDEERSSeoul, South Korea
ThailandREINDEERS FULFILLMENT CO., LTD.REINDEERSBangkok, Thailand
I-Market (Thailand) Co., Ltd.I-MarketBangkok, Thailand
MalaysiaReindeers SDN. BHD.REINDEERSShah Alam, Malaysia
China苏州睿鹿科技贸易有限公司Ruilu TechSuzhou, China
Expansion PlanYancheng, China · Vietnam2026 · 2027Jiangsu, China · TBD
CORPORATE STRUCTURE

Global Corporate Network

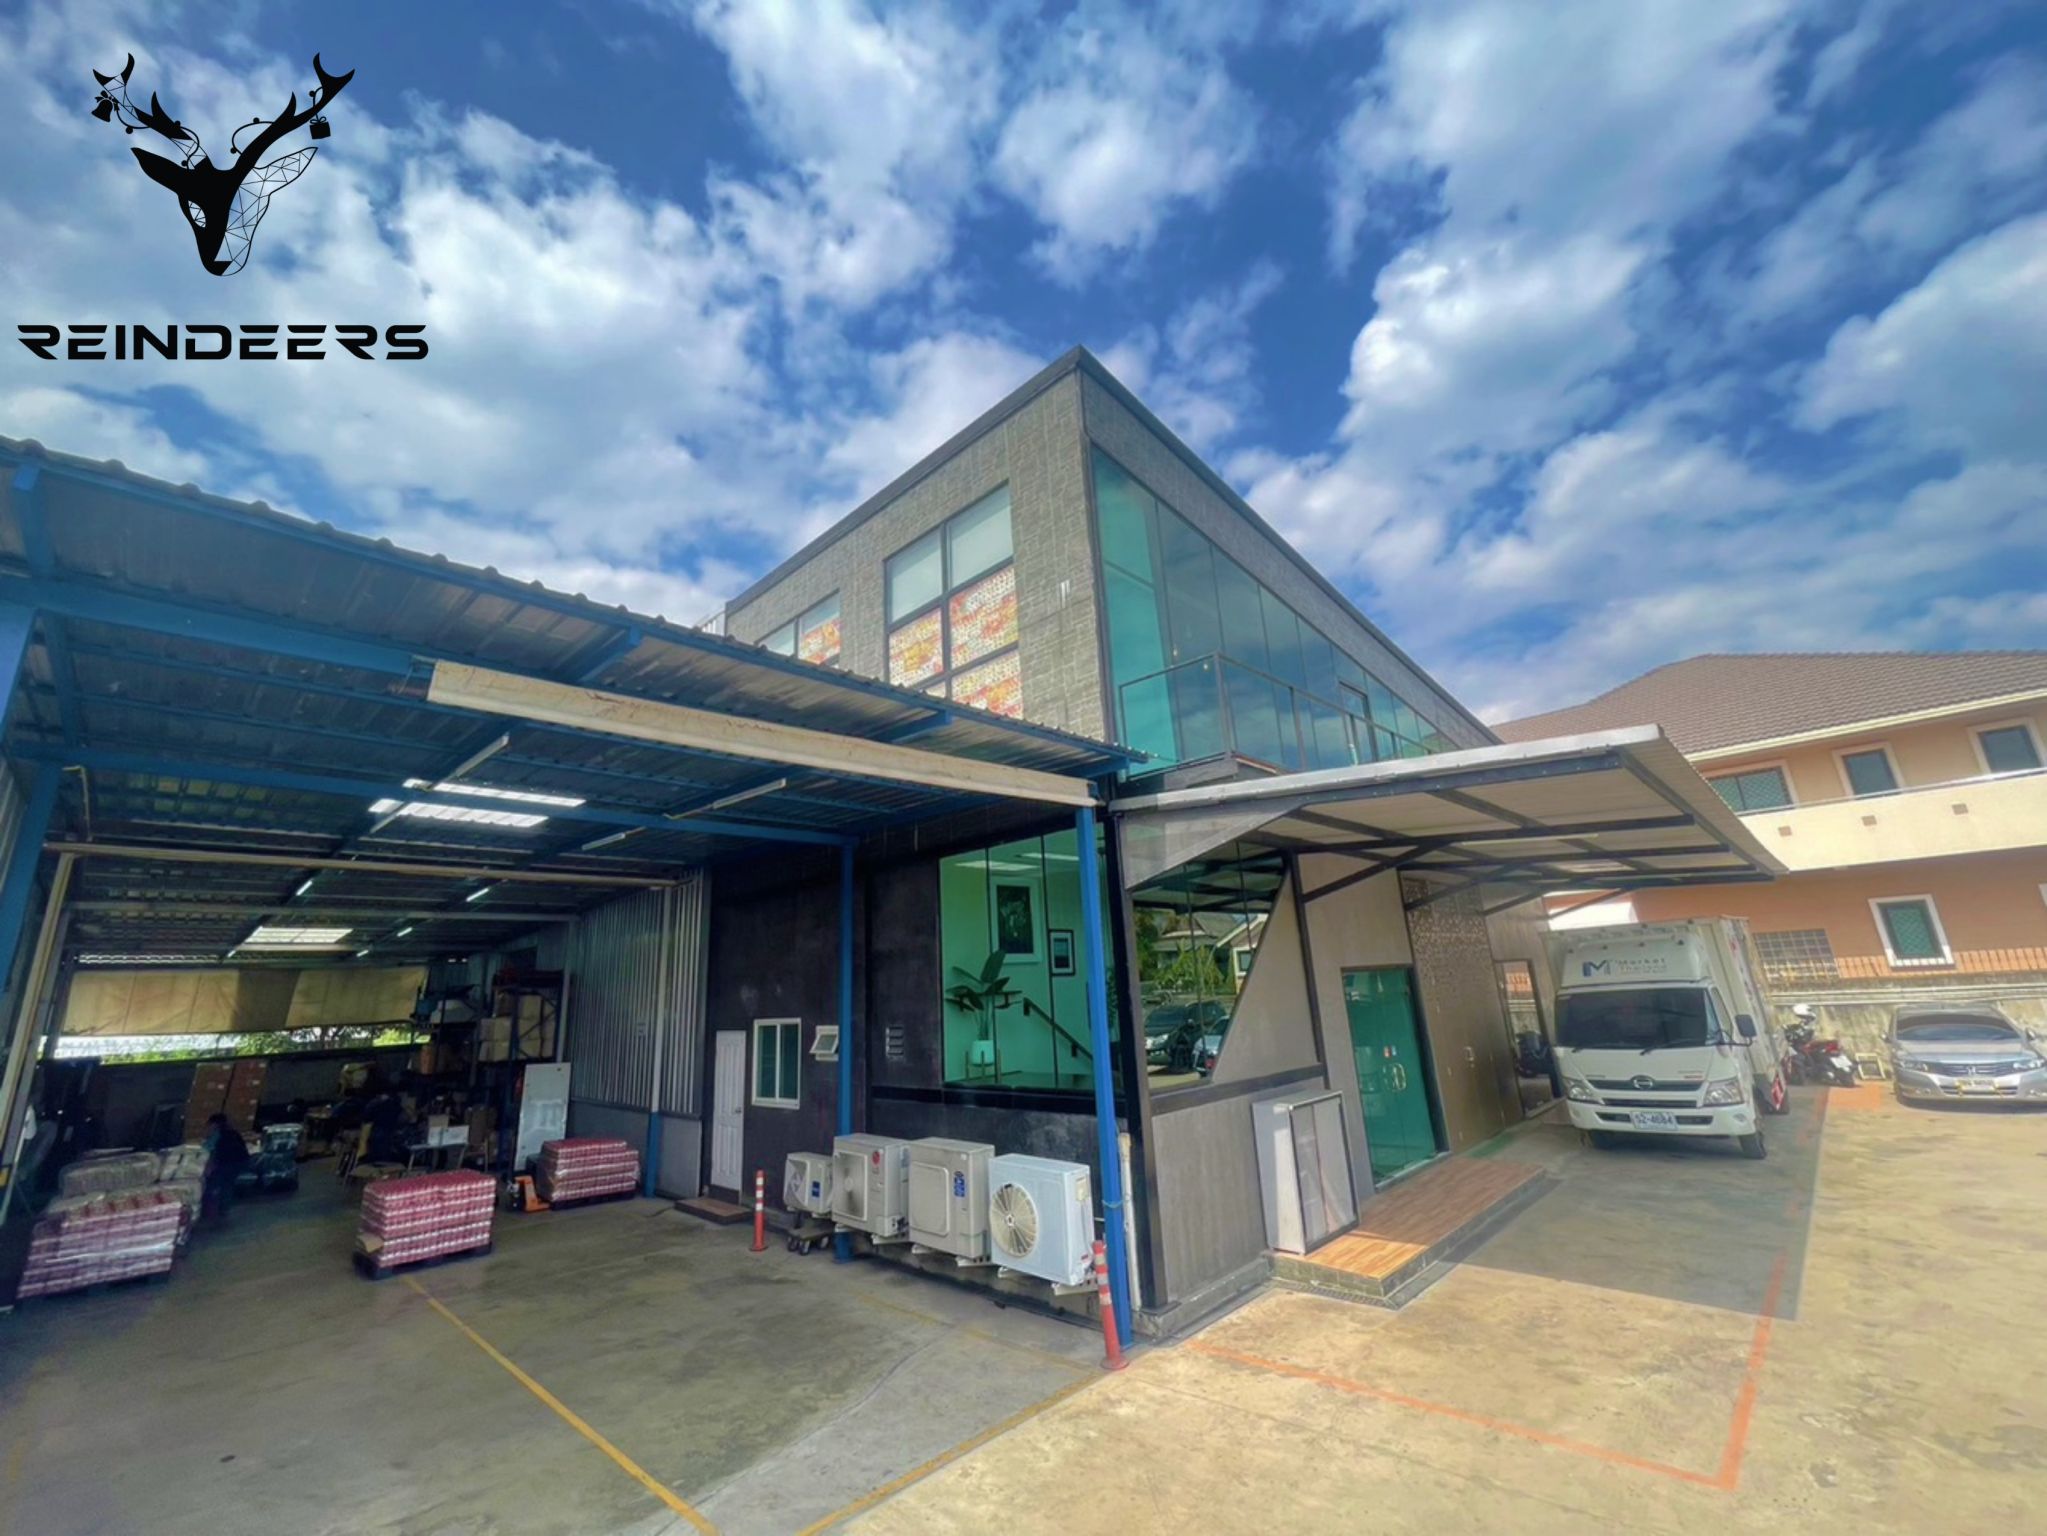
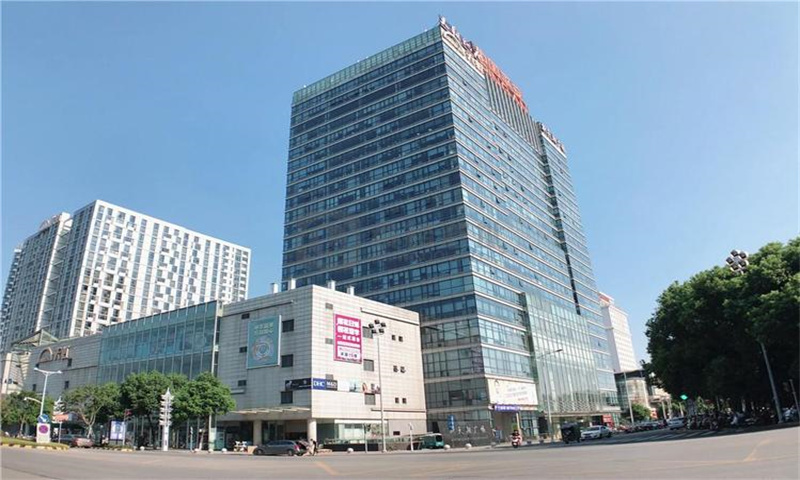
Holding & subsidiary structure of 5 entities across 4 countries, with expansion plans

Seoul (HQ) Yancheng '26 Suzhou Vietnam '27 Bangkok Shah Alam
Active Planned New Market
Seoul HQ
Korea (HQ)Seoul

⊕ REINDEERS

CEO 90%SDN.BHD. 10%
Bangkok office
ThailandBangkok · 2 entities

⊕ REINDEERS

I-Market 5%REINDEERS 95%

⊕ I-Market (Local 3PL)

MalaysiaShah Alam

⊕ REINDEERS

IMUSCLES 51%REINDEERS 49%
Suzhou office
ChinaSuzhou

⊕ Ruilu Tech

Current

Local Partner 100%

After change ↓

Local Partner 51%REINDEERS 49%
Expansion Roadmap
Yancheng, China 2026Vietnam 2027
CEO PROFILE

CEO Myunghoon Kim

CEO Myunghoon Kim
CEO Myunghoon Kim
2022~
CEO
2016~2022
Managing Director
2010~2014
Management Support Lead
2006~2008
Financial Controller
2003~2006
Finance Major

Southeast Asia Domain Expert

  • 20+ years of experience in Thailand & Southeast Asia
  • MBA from Assumption University, Thailand (Finance)

Major Corporation Management (10 Years)

  • Samsung Electronics Thailand, Management Support Lead
  • Integrated management of corporate ops, ERP, SCM, logistics & finance

Local B2B Business Operations (11 Years)

  • Established & operated integrated procurement & distribution company in Thailand
  • Secured 2,500+ clients and 1,800+ suppliers
  • Overland logistics expert: China-Laos-Thailand-Malaysia

Business Network

  • Supplied 150+ Korean companies incl. Samsung, LG, POSCO
  • Established Thai distribution network and BNI business network

20+ years in Thailand · 9 years major corp management · 11 years B2B supply chain — proven field expert

CORE TEAM

Core Management Team

Key talent from NHN affiliates — avg. 15+ years experience in commerce, logistics & AI

CSO
CSO

PARK JUNYOUNG

Ajou Univ. MBA (CS)

Career

  • MadeitUp CEO
  • Moonmoo Director
  • CustomMind CTO
  • NHN Accommate CTO

Expertise

  • Commerce/logistics strategy 20yr+
  • Org management & P&L
  • Cross-border BM design
  • NHN-proven strategic leadership
Global Commerce & AI
20+ Years
CPO
CPO

JIN CHENGJI

JiangXi Univ. CS

Career

  • Basheng Network Tech CEO
  • CustomMind Director
  • NHN Accommate Division Head

Expertise

  • B2B SaaS product planning 15yr+
  • Logistics workflow design
  • Commerce platform development
  • Data-driven UX optimization
B2B SaaS Product Planning
20+ Years
CTO
CTO

ZHOU QIRONG

SanJiang Univ. CS

Career

  • Basheng Network Tech CTO
  • CustomMind Division Head
  • NHN Accommate Team Lead

Expertise

  • AI/LLM/RAG practical application
  • Distributed systems 10yr+
  • Real-time data processing
  • NHN tech stack proven
AI · LLM · RAG Expert
15+ Years
COO
COO

ZHANG WEI

Shenzen Univ. FN

Career

  • SEA logistics operations 8yr+
  • Thailand/Vietnam partner development
  • Cross-border customs operations

Expertise

  • SEA network building
  • Logistics & customs optimization
  • 3PL ops & quality management
  • Local regulatory compliance
SEA Trade & Logistics Ops
8+ Years
MARKET SCALE

Target Market Size

The Asian B2B industrial materials market that REINDEERS targets is a massive, yet undigitized market.

$2.1T
ASEAN Manufacturing Output
$130B+
B2B Digital Commerce HKTDC 2025
4,300,000+
Total Manufacturers in Target

Registered Manufacturers by Country/Region

CountryReg. Manufacturersvs GDPKey Industries
Thailand79,000+26%Auto, Electronics, Food
Malaysia50,000+23%Electronics, Petrochemicals, Rubber
Vietnam140,000+24%Electronics, Textiles, Machinery
Laos+Cambodia+Myanmar16,000+15~20%Textiles, Agriculture, Light Industry
Indonesia30,000+20%Metals, Chemicals, Food
China3,500,000+27%All industries, Factory of the World
Korea430,000+25%Semiconductors, Auto, Steel

Target region manufacturers 4.3M+ — B2B digital adoption rate <5% — a massive untapped market for REINDEERS

MARKET ANALYSIS

Market Penetration & Revenue Growth Path

Current penetration 0.004% vs TAM $108B+ — overwhelming growth potential

TAM — SEA Industrial Materials B2B
$108B+
Thailand
$18.6B
Indonesia
$54.0B
Vietnam
$14.4B
Malaysia
$11.4B
Performance-based Market Penetration Path
YearRevenuevs ThailandStage
2024$0.66M0.004%Direct export 59 deals
2025$0.37M0.002%Direct export 18 deals · BM transition
2026$0.4M0.002%Platform BM transition
2027$1.8M0.010%Breakeven · 250 clients · Vietnam expansion
2028$4.6M0.020%Multi-country expansion
2030$23.6M0.10%Full-scale SEA expansion
$0.66M
2024 Direct Export
~90%
2024→2030 CAGR
0.10%
2030 Penetration

Even at 2030 target revenue $23.6M, Thailand market penetration is just 0.10% — overwhelming growth potential vs total SEA market

MARKET OVERVIEW

SEA Industrial Materials Market & Opportunity

15%
Annual Market Growth Rate
$108B TAM · Rapidly growing market
However
30%+
Transactions are delayed
Documentation errors · Manual work · No systems

System Disconnection

Trade, logistics, ERP systems operate independently
Less than 5% of enterprises have internal systems

Complex Distribution

Regional dealer margins 30%+
Import goods distribution margins 50%+

No B2B Platform

LAZADA·SHOPEE are B2C marketplaces
Industrial B2B direct trading unsupported

Manual Work · Decision Delays

Dependent on email & spreadsheets
No real-time data → Supply chain visibility impossible

SEA B2B Market Size

$54B ID $18.6B TH $14.4B VN $11.4B MY $9.6B PH Estimated based on ASEAN manufacturing GDP
$108B+
TAM — SEA Industrial B2B

$108B+ market growing 15% annually but 30%+ transaction delays — digitization below 5% — optimal platform entry timing

DIGITAL TRANSFORMATION GAP

Supply Chain with Zero DX/AX Transformation

DX - Digital Transformation

< 5%
Digital System Adoption Rate
Orders, quotes, logistics & settlements scattered across email & Excel
No dedicated B2B industrial materials marketplace
Complete disconnect between local and cross-border supply chains

AX - AI Transformation

<1%
AI Adoption Rate
Data exists but fragmented & unstructured across systems
Demand forecasting & risk management entirely experience-dependent
AI-capable areas like HS Code, TISI & quotes done manually
Current vs After REINDEERS
Work Area Current (Manual) After REINDEERS Impact
Quote Processing 2-3 days manual quote comparison AI auto quote comparison · under 30 min 90%↓
HS Code Classification Manual classification by staff · frequent errors AI auto classification · 85%+ accuracy 85%+
Logistics Cost Calculation Individual forwarder inquiries · 1-2 days Forwarder bidding · real-time comparison 15~20%↓
Inventory Management Manual Excel entry · no real-time capability POP real-time integration · auto alerts Real-time
Document Preparation Half-day manual work (CI · PL · B/L) Document AI auto-generation 80%↓
Work Process Email & phone · no tracking Workflow AI automation · end-to-end tracking Automated

No AX without DX, no DX without data — REINDEERS executes a sequential DX→AX transition model based on 11 years of field data

REGULATION ENFORCEMENT

Import/Export Regulation Enforcement & Opportunity

Problem

30%+
Counterfeit & uncertified product crackdown surging
Enforcement increasing 30%+ annually
Enterprise risk rising sharply
HS Code errors & TISI violations expanding

Opportunity

AI Automation
AI-powered certification & customs automation demand
HS Code auto-classification
TISI · CCC certification automation
Stricter regulation = direct platform demand

HSCODE / TISI Enforcement Record (2026 Est.)

CategoryValueYoY Change
Steel & construction materials seizure155M THB↑ 37%
Electrical & electronics130M THB↑ 32%
Tires & rubber products100M THB↑ 25%
Violating products destroyed1.8M units↑ 18%
URLs shut down online9,500+ (TISI Watch AI)↑ 30%

Legal Penalty Standards by Risk Type

CategoryValueYoY Change
Customs evasionFine of 50%-400% of unpaid duties↑ 85%
TISI violation (import)Up to 2 years imprisonment or THB 2M fine↑ 17%
False origin40%+ additional tariff on item duties↑ 16%
HS CODE violationMax fine THB 500K↑ 18%
Uncertified productsMax 6 months imprisonment / max fine THB 500K↑ 30%

Tighter regulations are an opportunity, not a crisis — directly creating market demand for AI-based certification & customs automation platforms

BUSINESS PIPELINE

REINDEERS Business Pipeline

Participants Client Reindeers + POP Trading · Corp. Operations Supplier Reindeers + POP Orders · Production Mgmt. Forwarder Reindeers Bidding · Transport Logistics Co. DVRP 3PL Logistics Mgmt. BUSINESS PLATFORM REINDEERS Commerce (Trade·Quotes·Payment·Bidding) Client·Supplier·Forwarder Usage In Operation DVRP 3PL Logistics SaaS · For logistics co. BETA POP Corp. Operations (MES+ERP+WMS) Includes email & corporate site Client·Supplier both use · Data lock-in 2026 Q2 AI PLATFORM Workflow AI Process automation Active Doc AI Auto doc generation (CI·PL·HS Code) Active Email AI Email automation BETA Site AI Auto corp. website generation BETA Works AI Corp. automation (AI Agent Ops) Planned DATA FLYWHEEL AI Engine Usage Learning Accuracy↑ Personalization Commission GMV×10% SaaS $690~2,070/mo AI Token Pay-per-use Logistics Fee 10%

Participants (Clients, Suppliers, Forwarders, Logistics Co.) → Business Platform (REINDEERS, DVRP, POP) → AI Platform auto-processes → Data flywheel makes AI continuously smarter

PLATFORM FLOW

Platform Flow — Journey of a Single Transaction

Client POP ↔ REINDEERS ↔ Supplier POP real-time integration

Client POP REINDEERS Platform Supplier POP 1 Purchase need → Order via POP Auto request form from POP purchase module 2 Supplier Matching Optimal supplier recommended from trade, quality & delivery data 3 Auto order receipt in POP RFQ received · auto notification sent 4 Quote Compare & Payment Auto-compare price, MOQ & lead time → PO confirmed REINDEERS Escrow Payment Advance T/T · L/C → Commission GMV×10% charged Order Confirmed · Production Start Schedule auto-registered in POP module 5 Forwarder Bidding Auto bidding · CI, PL, B/L, C/O, HS Code auto-generated 6 DVRP Logistics Tracking Real-time tracking & customs → Auto-alert → Logistics fee 10% 7 POP Auto Inbound Update POP warehouse module inspection → Inventory auto-updated 7 POP Auto Outbound Update POP warehouse module outbound → Revenue auto-recorded Both POP inbound/outbound synced in real-time Transaction data auto-accumulated → AI training data 8 Settlement & Performance Review Escrow settled · AI evaluates performance · Data learning Full process data → AI learning → Next transaction more accurate Before: Email & Excel manual work → 30% delays · Data loss Manual entry · inter-dept silos · recurring delivery delays REINDEERS: AI automation → 50% reduction · Real-time integration POP auto-sync · AI doc generation · Data accumulation

Full process data → AI learning → Next trade more accurate | Before: Email & Excel → 30% delays | REINDEERS: AI automation → 50% reduction

LOCK-IN MECHANISM

Customer Lock-in — Why They Cannot Leave

~Year 1
~Year 2
Year 3~

1. LAND

List $2,070/mo
POP $690/mo
MES+ERP+WMS+Email+Site all-in-one
67% discount for fast onboarding
1yr operational data accumulation

2. EMBED

Data Lock-in
Trade History Supplier Rels AI Training Data Email Archive Corp Website
Switching cost > Retention cost

3. EXPAND

$690 $2,860/mo
SaaS $2,070 + AI Token billing
Marketplace auto-integration
AI Agent · Workflow automation
NETWORK EFFECT Buyers ↑ Suppliers can't leave Suppliers ↑ Buyers can't leave

Client (Buyer)

POP for ordering, settlement, logistics
AI recommendations
Access more suppliers
Repeat rate 70–80%

Supplier (Vendor)

POP MES+ERP+WMS integrated
Email, site, AI locked to POP
Revenue loss if leaving
Switching >> Retention

Forwarder

Bidding → track record
AI ranking → win rate
Track record reset if leaving
Bidding record · AI ranking locked

POP all-in-one infrastructure owns data → Buyer, supplier & forwarder 3-party simultaneous lock-in · Switching cost > retention cost structure established

OUR APPROACH

3-Stage Supply Chain Integration → AI Technology

STAGE 1 Local Supply Network 11 years of Thailand ops verified 2,500+ Clients · 1,800+ Supplier Country-by-country replication Procurement, pricing & inventory data Core AI training data secured ✓ Verified STAGE 2 Cross-border Supply Network Korea & China supply hub ↔ Connected to SEA demand market Logistics, customs & certification data Local data + Cross-border combined End-to-End visibility secured ▶ In Operation STAGE 3 AI Supply Chain Infrastructure AI infra based on integrated data Demand forecast · Supplier matching Logistics optimization · Risk mgmt. RAG + AI Agent Automated Supply chain decision engine ▶ 2026 Launch Local data (11 yrs) → Cross-border integration → AI infra = E2E automation Each stage's data becomes training data for the next stage's AI

Thailand Local 11 years verified (2015~) → Incorporation (2022) → AI Launch (2026)

Country-by-country replication + Cross-border integration for End-to-End infrastructure.

AI AGENT VISION

Works — AI Agents Run Corporations

Works for POP users: CEO Agent directs Agent teams for autonomous corp. ops — multiple AI entities & subsidiaries possible

User (Human) CEO Agent Strategy · Resource allocation · KPI monitoring Procurement Agent Production Agent Sales Agent Logistics Agent Finance Agent Customs Agent 👤 Vendor contact 👤 Factory / 🤖 Robot 👤 Sales rep. 👤 Driver / 🤖 Robot 💻 Auto-processed 💻 Auto-processed 👤 = Human   🤖 = Robot   💻 = Fully auto   |   Humans on-site until robots deployed
Autonomous Execution

Self-decomposes & executes tasks
to achieve goals without instructions

Monthly Budget Limit

Budget cap set per agent
Requests user approval if exceeded

Audit Trail

All decision logs recorded
Real-time dashboard monitoring

Escalation

High-uncertainty decisions
immediately reported to human for approval

AI Agent team handles work of 10 employees — User focuses on strategy · Can operate multiple AI entities & subsidiaries

AI AGENT ROADMAP

AI Agent Evolution Roadmap (2026-2030)

From simple automation tools to autonomous corporate operations, AI Agents evolve through 4 stages.

1
2026

Tool

Automated 20%

Auto quote & order generation Document AI auto-processing Simple repetitive task automation Quote Request AI(Q2) · Quote Issue AI(Q2) · Forwarding Quote AI(Q3)
Agent 2–3
Key shift: Human instructs → AI executes
2
2027

Assistant

Automated 50%

Multi-step workflow execution Auto supplier matching & negotiation Logistics route optimization proposals
Agent 5–6
Key shift: AI suggests → Human approves
3
2028–2029

Agent Team

Automated 80%

Autonomous inter-agent collaboration Auto exception handling Simultaneous multi-country operations 3PL AI control(Q1) · WMS AI inventory(Q2) · POP AI optimization(Q3)
Agent 8–12
Key shift: AI team autonomous → Human handles exceptions
4
2030

Autonomous Operator

Automated 95%

Fully autonomous corporate operations Strategic decision support Humans only supervise & approve
Agent 15-20
Key shift: AI runs company → Human sets strategy

Tool(20%) → Assistant(50%) → Agent Team(80%) → Autonomous Operator(95%) — gradual autonomy over 5 years

WHY ONLY POP

Why Only POP Can Enable AI Agent Corp. Ops

① Company-wide Data Access

POP ALL-IN-ONE

MES+ERP+WMS unified in one DB. Agents access inventory, production, finance & logistics data in real-time

② Execution Infrastructure

6 Platforms Connected

REINDEERS, DVRP, Forwarder Bidding, POP, Document AI & Workflow AI connected. Agents directly execute ordering, shipping & settlement

③ Domain Training Data

11 years × 25,000+ real transactions

Generic AI cannot create trade documents. POP's AI is a domain-specific model based on real transactions. Evidence-based judgment without hallucination

3 Key Conditions vs Competitors

PlayerCompany-wide Data AccessExecution InfrastructureDomain Training DataAI Agent Corp. Ops
SAP · OracleNot Possible
AlibabaNot Possible
FlexportNot Possible
Generic AI (ChatGPT etc.)Not Possible
REINDEERS POPPossible
Current TAM
SaaS Subscription
MES+ERP+WMS monthly fee
Expanded TAM
AI Agent Corp. Operations Service
Subscription + Agent execution fee + Performance reward

Data + Execution Infrastructure + Domain Knowledge — POP is the only player with all 3 simultaneously

DATA ASSET

Data Asset — Data Is the Competitive Edge

Layer 1 — Local Transactions

Thailand local real transaction data

25,000+Transactions
11 yearsYears
Layer 2 — Cross-border

International trade, logistics & customs

8,400+HS Code
5 CountriesRoutes
Layer 3 — Integrated Supply Chain

POP + DVRP integrated supply chain data

2,500+Clients
1,800+Supplier

AI: Demand patterns · Price changes · Delivery forecasting

AI: HS Code auto-classification · Customs risk · Route optimization

AI: Supply chain E2E optimization · Forecasting · Agent automation

2026-2030 Data Accumulation Plan

YearCumulative TradesHS Code CoveragePOP-connected FactoriesCountryAI Training Data Scale
202628,000+8,400+50+3Foundation
202735,000+10,000+250+4Enhancement 1Stage
202850,000+12,000+600+5Enhancement 2Stage
202980,000+15,000+1,200+6Autonomous Ops Transition
2030120,000+18,000+2,000+7+Full Autonomy

RAG Engine Architecture

Vector DB
Unstructured data embedding
Structured DB
Trade, logistics & finance structured data
Domain Knowledge Graph
HS Code, regulations & supplier relationships
Feedback Loop
AI results → Re-training → Enhancement
“This data cannot be bought with money.”
Accumulated in the field over 11 years
25,000+ real trade, logistics & customs data
4,300+ verified partner relationships
A core asset impossible for latecomers to replicate

3-layer data asset + RAG Engine — AI accuracy progressively improves in proportion to data accumulation

BUSINESS MODEL

Business Model — 3 Revenue Engines

Commission

GMV × 10%
Transaction-proportional revenue
Auto-billed on client·supplier transactions

SaaS Subscription

DVRP $690/mo~
POP $690 → $2,070
Fixed MRR · revenue even without transactions

AI Token

Doc AI + Workflow AI
Usage-based billing
More transactions → more Token consumption
YearClientsGMV ($M)Commission ($M)SaaS+AI ($M)Total Revenue ($M)Operating Profit ($M)
20261203.50.350.040.4−0.16
2027250151.500.261.77+1.05
2028450393.900.714.60+3.15
2029750939.271.6210.90+8.27
20301,25020320.303.3723.60+18.50
Breakeven
2027
Take Rate
11.7%
Repurchase Rate
70–80%
GMV CAGR
~176%

Commission + SaaS subscription + AI Token = triple revenue engine · Breakeven 2027 · GMV $3.5M→$203M (CAGR ~176%)

UNIT ECONOMICS

Unit Economics per Client

LAND Year 1
POP SaaS$690/mo
Commission (GMV $5,170×10%)~$517/mo
AI Token~$69/mo
Monthly ARPU ~$1,280
Annual ~$15.3K
EXPAND Year 2+
POP SaaS (regular price)Monthly $2,070
Commission (GMV $6,900×10%)~$690/mo
AI Token (usage increase)~$103/mo
Monthly ARPU ~$2,860
Annual ~$34.3K
ARPU Growth
2.4x
$1,120 → $2,660
CAC Payback
1 Month
1st month ARPU > CAC
LTV
3-4 years
Repurchase rate 70-80%
LTV/CAC
> 10x
SaaS excellence standard 3x+

Year 1 ARPU $1,120 → Year 2 $2,660 (2.4x) · CAC payback 1 month · LTV 3-4 years · Repurchase 70-80% · Natural lock-in via data ownership

GROWTH DRIVERS

Revenue Growth Drivers

1
Client Growth
POP onboarding → Marketplace inflow → Viral spread
2026 → 2030
120 → 1,250
2
Transaction Frequency Growth
AI reorder recommendation · Workflow automation → Order frequency increase
Monthly avg.
2.5 → 6.8 times
3
Per-transaction Amount Growth
Supplier diversification · Higher-value category expansion → AOV increase
Per tx.
$2,070 → $2,480
4
SaaS ARPU Growth
Year 1 discount → Year 2 regular price + Module additions
Monthly
$690 → $2,070
5
AI Token Usage Growth
Doc AI · Workflow AI adoption increase → Usage-based revenue growth
Client penetration
Growing ↑
Compound Growth Effect
Clients × Frequency × Per-tx Amount × ARPU × AI Token
GMV CAGR
~176%

5 drivers compound → GMV $3.5M→$203M (CAGR ~176%) · Clients, frequency, amount, ARPU & AI all grow simultaneously

COMPETITIVE ADVANTAGE

Competitive Analysis & Positioning

DimensionAlibabaFlexportSAP·OracleREINDEERS
Trade Platform
Logistics (WMS/3PL)
POP (MES+ERP)
Forwarder Bidding
AI Agent Automated
SEA Specialized
SME Pricing

Positioning Map: Integration × Transaction Depth

High Integration Low Integration Shallow Deep REINDEERS SAP Flexport Alibaba
PATENT PORTFOLIO

Patent Portfolio & IP Roadmap

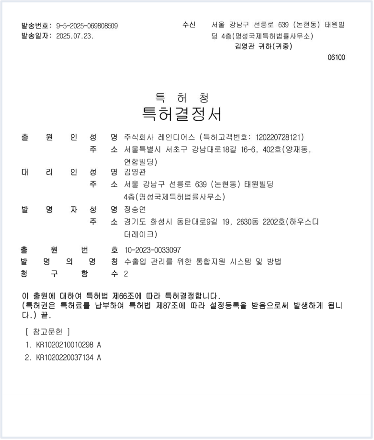
2023 Patent Registered

Integrated Support System & Method for Import/Export Management

Patent No. 2746311 · Registered with KIPO

Patent Decision
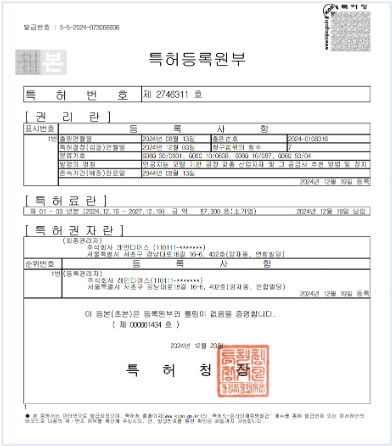
2024 Patent Registered

AI Model-based Process-customized Industrial Materials & Supplier Recommendation Method and Apparatus

Patent filed & registered with KIPO

Patent Registration Certificate

IP Roadmap

Year#Patent NameStatus
2023#1Import/Export Integrated Support SystemRegistered
2024#2AI-based Industrial Materials & Supplier RecommendationRegistered
2028#3POP Automation & AI Agent Corp. Operations SystemPlanned
Additional patent filings as neededUnder review

IP Status

2
Domestic patents registered
1+
Additional filing planned

Legally reinforcing the technical moat through IP protection of core AI technology

2 registered + 2028 POP automation patent planned — IP portfolio expansion with additional filings as needed

REVENUE

Revenue & 2026-2030 Growth Plan

2025 Revenue (Direct Export)
$0.37M
Net revenue ~$35K · Operating loss
2026 Target (Platform Transition)
GMV $3.5M
Total Revenue $0.4M · Client 120
2027 Breakeven
GMV $15M
Total Revenue $1.8M · Client 250
2030 GMV Target
GMV $203M
Total Revenue $23.6M (11.7%)
$210M $140M $70M 0 $3.5M $0.4M 2026 $15M $1.77M 2027 $39M $4.6M 2028 $93M $10.9M 2029 $203M $23.6M 2030 GMV ($M) Total Revenue ($M)
Unit: $M (USD millions)
Year Clients GMV Commission SaaS · AI Total Revenue OPEX Operating Profit
2024 0.66 0.07 0.07 0.41 -0.34
2025 0.37 0.03 0.03 0.41 -0.38
2026 120 3.5 0.35 0.04 0.40 0.55 -0.16
2027 250 15 1.50 0.26 1.77 0.72 +1.05
2028 450 39 3.90 0.71 4.60 1.45 +3.15
2029 750 93 9.27 1.62 10.90 2.62 +8.27
2030 1,250 203 20.30 3.37 23.60 5.17 +18.50

Commission: GMV × 10% | SaaS: DVRP · POP subscription | AI: Document · Workflow Token
Per-client avg. monthly orders 2.5→6.8, $2,070~2,480 per transaction. Detailed basis: next page

HOW WE EARN

2027 Revenue Structure

How 1 transaction becomes revenue (2027 breakeven basis) Client 250 companies (2027) 120 → 250 ×2.1 growth × Per-Order Amount 310 $0K (2027) $2,070 → $2,140 SEA avg. unit price × Monthly Tx Frequency 3.2 times/mo (2027) 2.5 → 3.2 times ×1.28 growth Annual GMV 220 $0M (2027) Existing 12mo + New 6mo weighted Breakeven point Take Rate 11.7% Commission 10% + SaaS + AI Commission 22.000M 86% 10% of GMV Auto-billed on all transactions · Core revenue source Charged across entire order-pay-settle process SaaS Subscription 2.800M 11% DVRP (logistics) + POP (procurement, production, inventory) Monthly subscription $690~900/co · MRR based Monthly recurring revenue regardless of transactions AI Token 0.900M 3% Document AI + Workflow AI usage billing Monthly ARPU $69~103 · Usage proportional AI accuracy up → Dependency up → ARPU rises 2027 Total Revenue $1.77M · Operating Profit +$1.05M

Every transaction auto-generates 11.7% platform revenue — 2027 breakeven: 250 clients × ~$2.1K per tx × 3.2 times/mo = GMV $15M → Total revenue $1.77M (OP +$1.05M)

GROWTH BASIS

Growth Basis & Bottom-up Verification

1Per-Client Order Metrics

Year Per-Order Amount Monthly Freq. Monthly/Client Annual/Client
2026 $2,070 2.5 times $5,170 $62K
2027 $2,140 3.2 times $6,840 $82K
2028 $2,210 4.2 times $9,270 $111K
2029 $2,340 5.5 times $12.9K $155K
2030 $2,480 6.8 times $16.9K $203K

Based on SEA supply chain avg. order value, reflecting natural transaction frequency growth

22026 Monthly Client Onboarding

5Jan 6Feb 8Mar 9Apr 10May 10Jun 11Jul 11Aug 12Sep 12Oct 13Nov 13Dec Total 120 companies | 681 client-months × $5,170 = GMV $3.5M

3GMV Bottom-up Verification

Year Existing × Annual GMV New × Half Year Calculated GMV
2026 681 client-months × $5,170 $3.5M
2027 120 × $82K = $9.85M 130 × $41K = $5.34M $15M
2028 250 × $111K = $27.75M 200 × $56K = $11.1M $39M
2029 450 × $155K = $69.5M 300 × $77K = $23.2M $93M
2030 750 × $203K = $152M 500 × $101K = $50.7M $203M

Existing clients 12 months + New clients avg. 6 months reflected

4Revenue Stream Details

Year Commission
(10% gross)
SaaS
(DVRP·POP)
AI Token
(Doc·WF)
Total Revenue
2026 $0.35M $0.03M $0.01M $0.40M
2027 $1.52M $0.19M $0.06M $1.77M
2028 $3.89M $0.50M $0.21M $4.60M
2029 $9.27M $1.06M $0.57M $10.90M
2030 $20.28M $2.10M $1.26M $23.64M

Commission: 10% | SaaS ARPU $690→$900/mo | AI ARPU $69→$103/mo

Per-client order = per-tx amount × monthly frequency | Existing clients 12mo + New 6mo reflected | Commission 10% | SaaS · AI additional revenue streams

CUSTOMER EXPANSION

Client & Supplier Expansion Strategy (2026-2030)

1 buyer onboarding = N suppliers auto-inflow. Warm lead sales leveraging 4,300+ existing relationships.

YearClient·SupplierForwarderCountryGMVGrowth Driver
202612030+2 Countries$3.5MExisting 4,300+ warm lead conversion + POP onboarding
202725040+3 Countries$15MRepurchase 70-80% + Network effects begin
202845050+4 Countries$39MAI accuracy improves → Match rate↑ → Satisfaction↑
202975060+5 Countries$93MSupplier pool expands → Price competitiveness↑ → Buyers↑
20301,25070+6 Countries$203MPlatform itself becomes industry infrastructure

Stage 1: Warm Lead Sales

Existing 4,300+ partners = warm calls, not cold calls
POP $690/mo onboarding = low barrier
120 clients = just 2.8% conversion of existing base
Leverage 150+ Korean enterprise relationships (Samsung, LG, POSCO)

Stage 2: Network Effects

Buyer onboarding → suppliers naturally inflow
2027 at 250 co. = two-sided network activates
More suppliers = more choices for buyers

Stage 3: Ecosystem

POP data ownership → switching cost↑
Repurchase 70-80% → natural expansion
2030: “Can’t trade without this platform”
Trading itself becomes impossible without the platform

Warm lead sales leveraging 4,300+ existing relationships → POP onboarding → Data ownership → Network effects → Ecosystem infrastructure

GLOBAL EXPANSION

Global Expansion Strategy

Phase 1 Target Countries

1
TH Thailand
Thai market · Initial validation complete
Immediate
2
Indochina Peninsula Neighbors
Indochina Peninsula logistics connection
2026 Q3
3
China
World's largest manufacturing & trade market
2026 Q3
4
VN Vietnam
High growth potential
2027
5
US, Korea & Northeast Asia
Large-scale B2B market
2027+

Platform Elements by Country

Localization

Language, currency, trade regulations & tax system adaptation

Local Partnerships

Partnerships with local forwarding, logistics & financial institutions

Regulatory Compliance

Country-specific data sovereignty & privacy law compliance

Payment Systems

Credit cards, bank transfers & mobile pay integration

Shared common tech base → Core platform code, AI models & data schema shared, minimizing development cost for new countries

Independent platform structure per country for customized response to market regulations, language & business practices, while maximizing core technology development efficiency

2026-2030 ROADMAP

2026-2030 Growth Roadmap

20262027202820292030
Client·Supplier1202504507501,250
Country2 (TH · CN)3 (+MY)4 (+VN)5 (+IN)6 (+KR)
GMV$3.5M$15M$39M$93M$203M
Operating Profit-$160K+$1.05M+$3.15M+$8.27M+$18.5M
Patents467810+
Team17254060100
AI AgentTool (20%)Assistant (50%)Agent Team (80%)EnhancementAutonomous (95%)
MoatData OwnershipNetwork Critical MassAI Gap WidensScale DominanceEcosystem Moat
Key Milestones

2026 Q1 ✓ 59 deals closed (0→1 validation)
Breakeven (250 co. = Network effects)
2030 GMV $203M · Operating Profit $18.5M

Conservative Scenario (80% Achievement)

2030 GMV $162M
Operating Profit $14.8M
Still meaningful scale growth

2026 Q1: 59 deals closed (0→1 verified) · 2027 breakeven · 2030 GMV $203M · Operating profit $18.5M | Conservative (80%): GMV $162M · Profit $14.8M

NETWORK

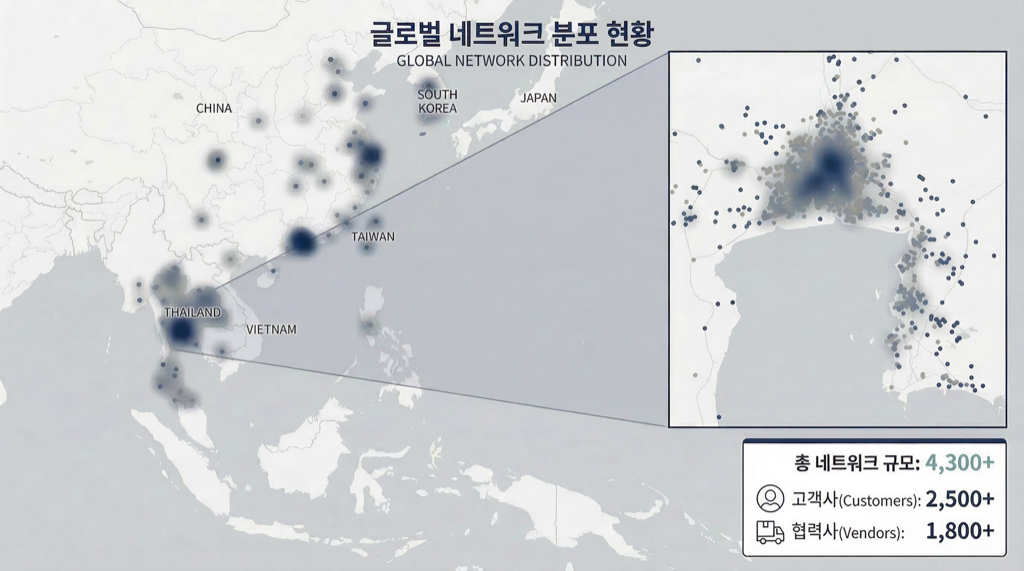
Global Network Status

11 years of accumulated SEA & East Asia manufacturing & trade partner network

Global Network Distribution

Total network 4,300+ — Clients 2,500+ · Vendors 1,800+ — Thailand · Korea · China · Vietnam · Malaysia

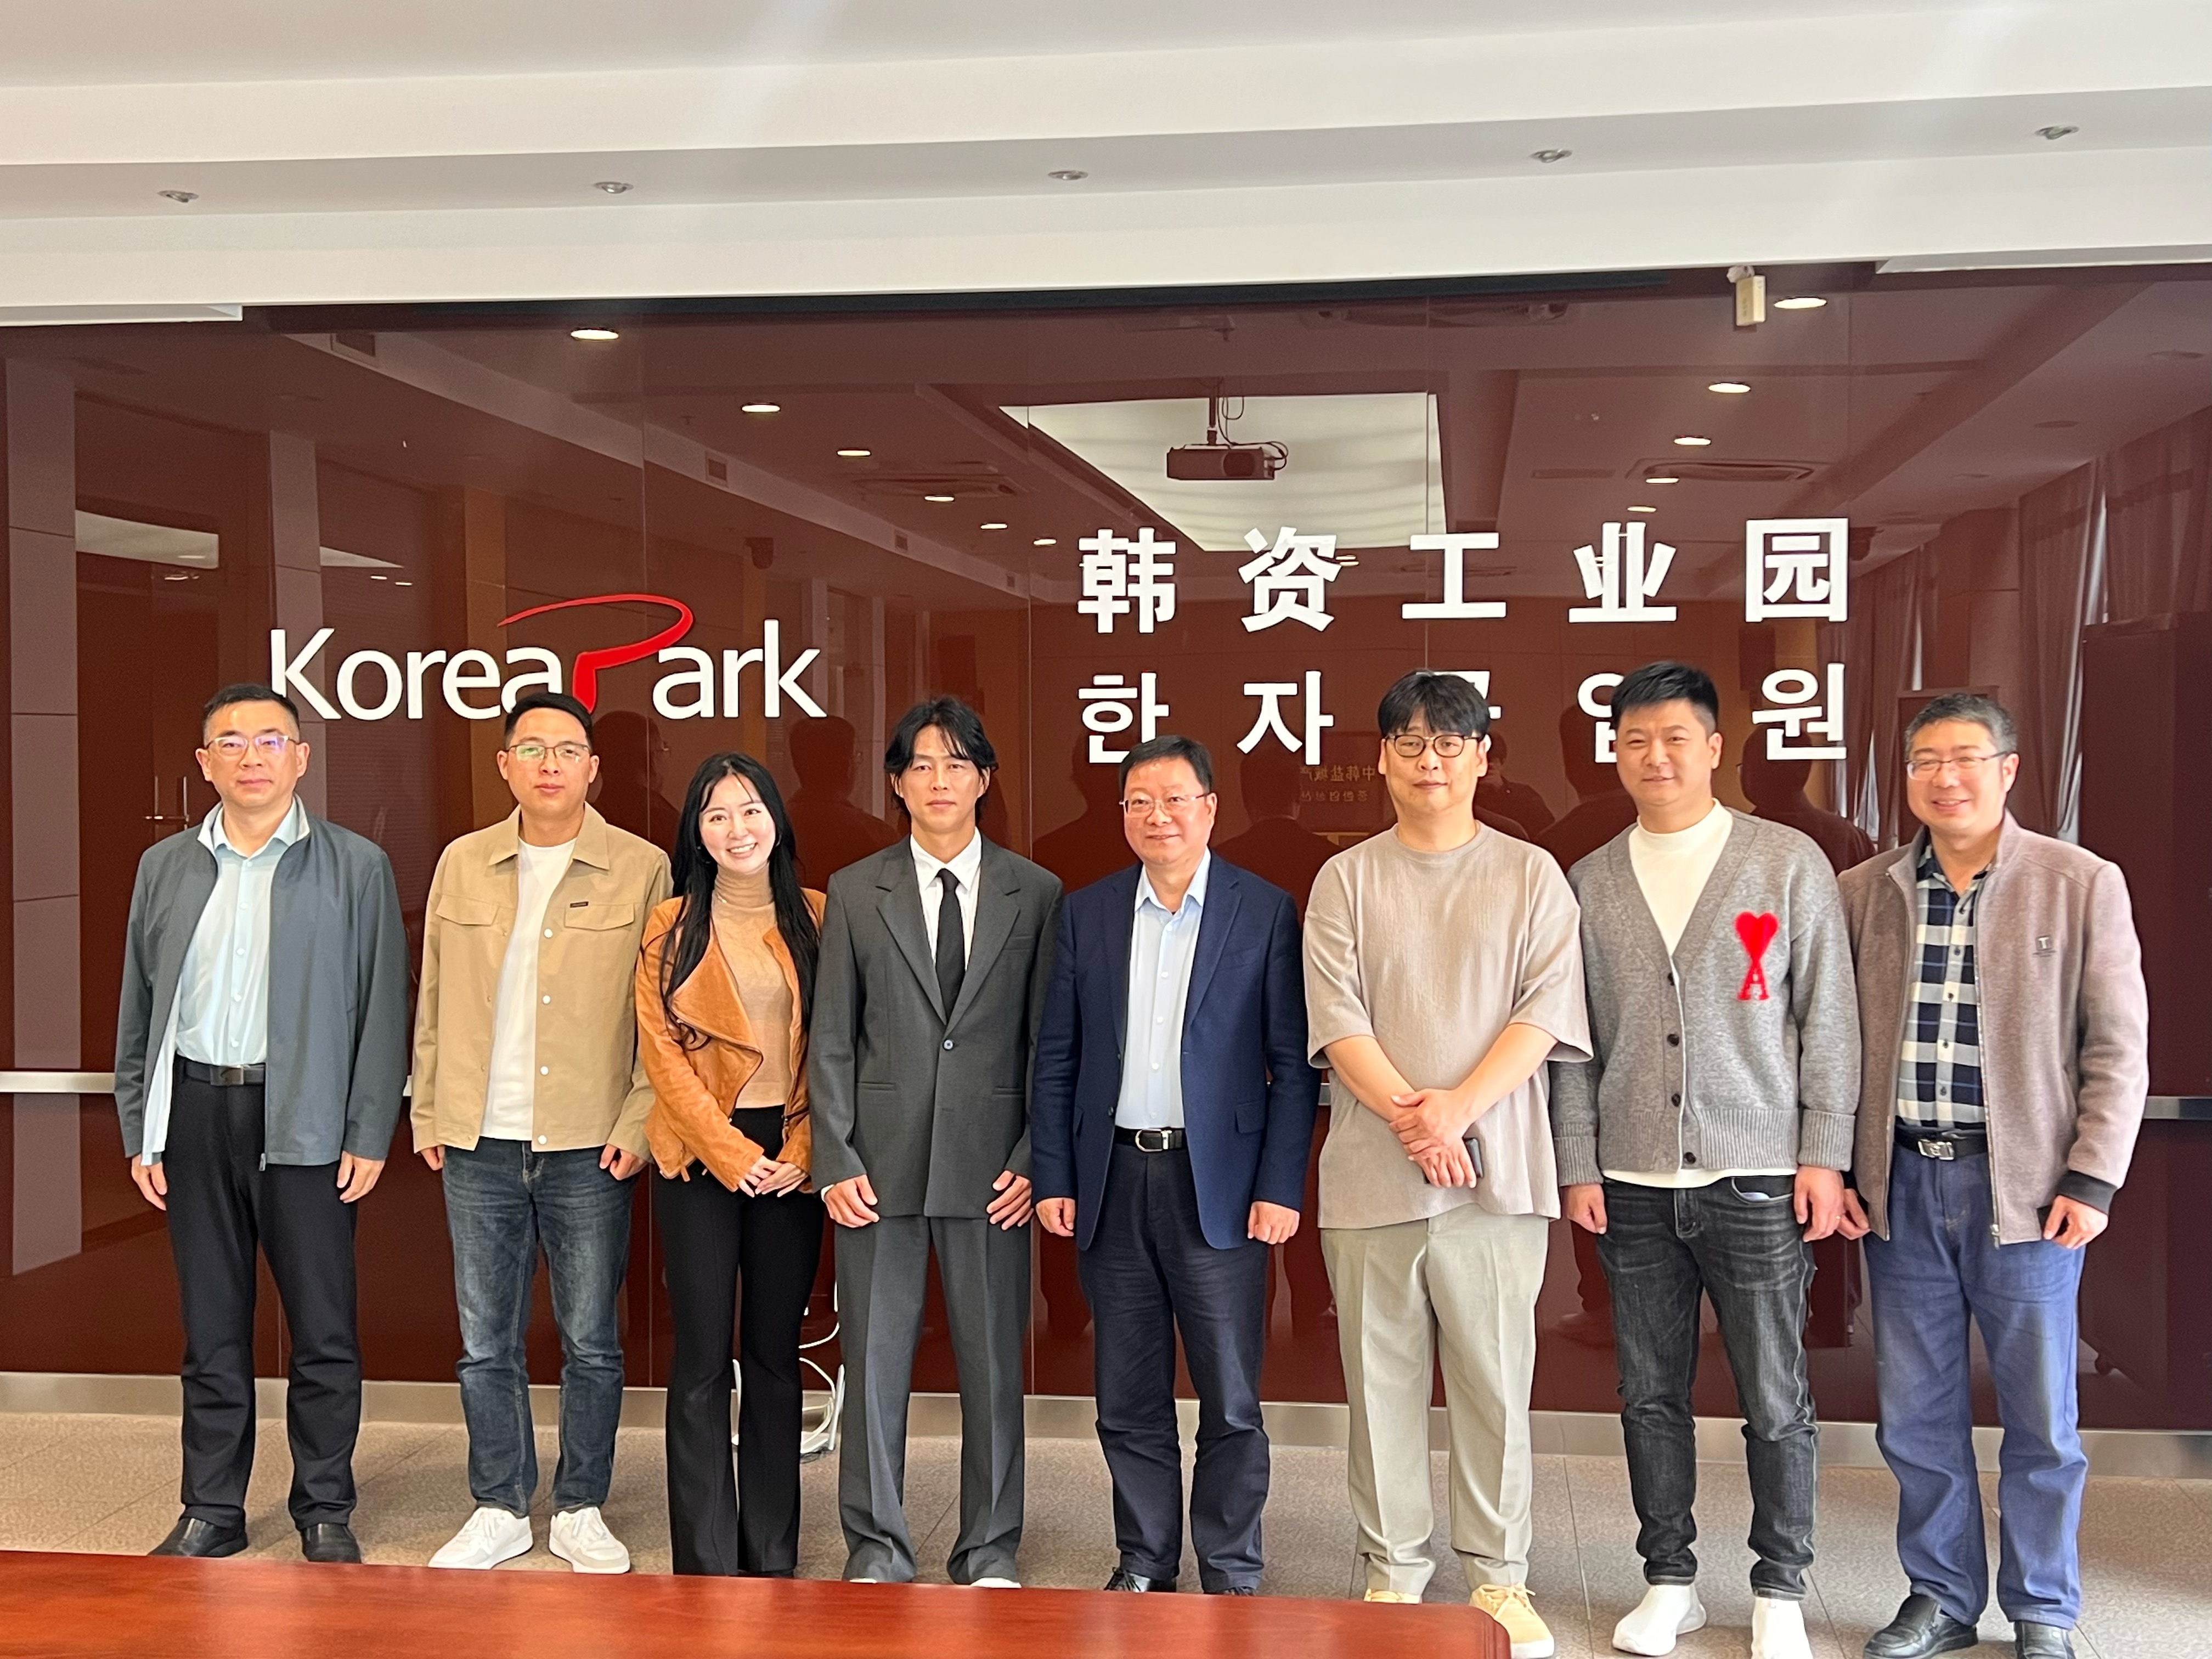
CHINA GOV'T MOU

China Government Partnership — Yancheng MOU Planned & Shanghai Negotiations Underway

Direct meeting with Yancheng City Secretary (mayor-level) completed · Official MOU announcement at Korea-China FTA Round 2 Dinner (2026.05.20)

Meeting with Yancheng Secretary Zhang Mingjun
✓ Meeting Completed · 2026.04
Zhang Mingjun, Yancheng Secretary & REINDEERS
Relationship Background
CSO previously signed MOU with Yancheng during NHN Acommate CTO tenure → Reconnected after 10 years via direct Secretary meeting. Long-term trust-based partnership.
🇨🇳 Yancheng Support Package NEGOTIATING
Bonded Warehouse
Dev Zone Office
Residency Support
2027+ Funding
Permits & Licenses
Jiangsu B2B Link
★ With export agent license, suppliers without own permits can export under REINDEERS → expanded supplier pool
Official MOU Announcement — 2026.05.20 (Yancheng)
Korea-China FTA Round 2 Prep Dinner · REINDEERS × Yancheng City MOU
KR) MOTIE · KOTRA · Korea-China B2B Companies / CN) Yancheng Gov't · Customs · Development Zone
🇨🇳 Shanghai Negotiations Underway IN PROGRESS
Gentle Monster CFO (CSO family) network connecting Shanghai gov't senior officials · Apr 20~21 Online meeting with People's Rep · Late Apr ~ Early May On-site MOU meeting

Government Partnership = Minimized China market entry risk · Accelerated supplier onboarding · Cross-border licensing Fast-Track

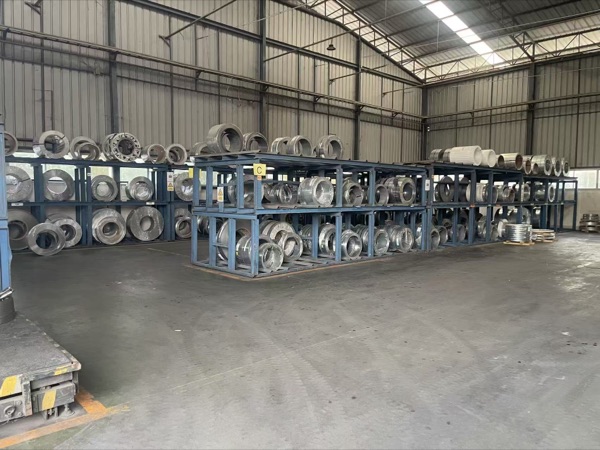
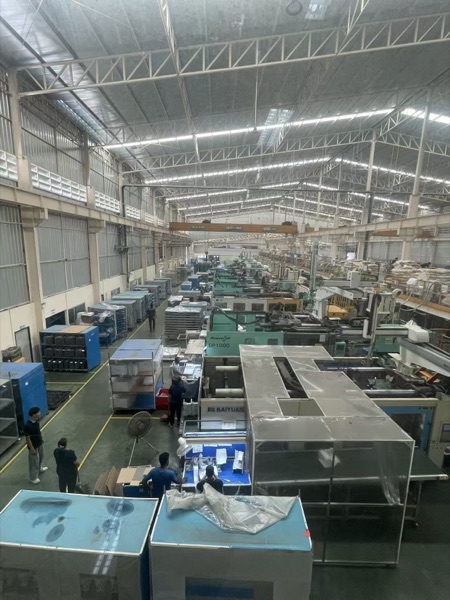
ON THE GROUND

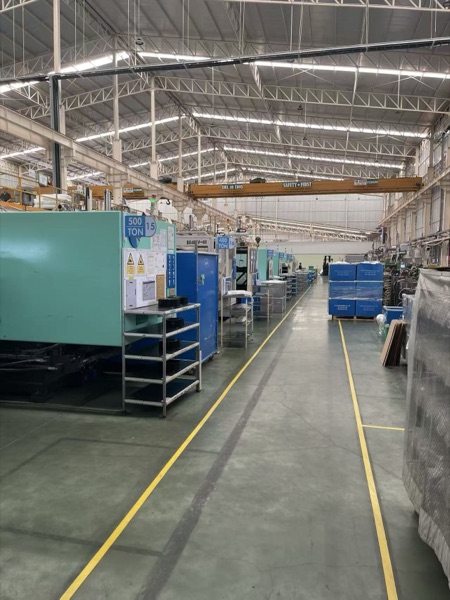
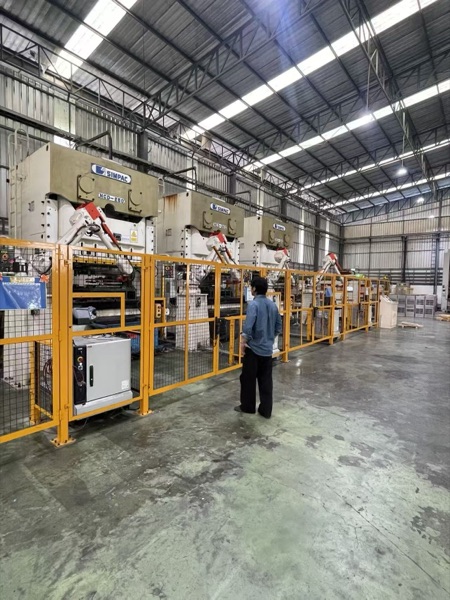
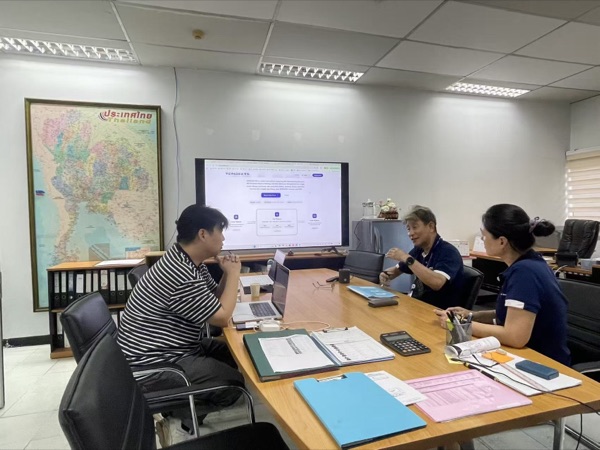
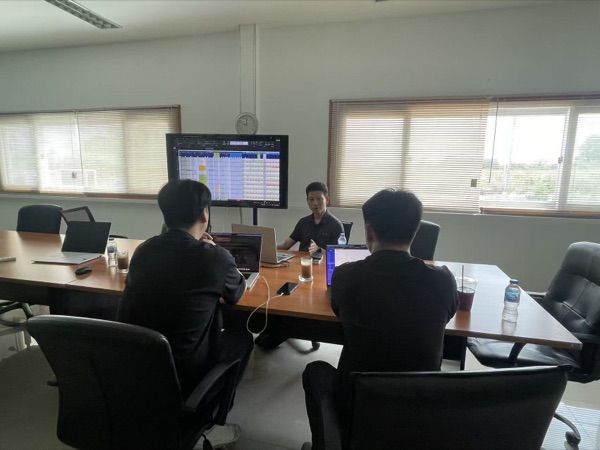
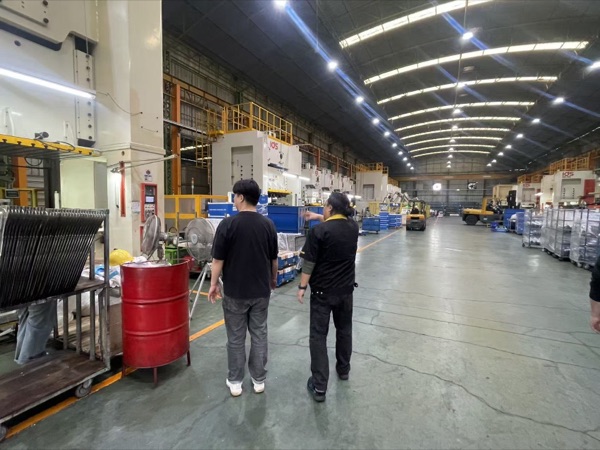
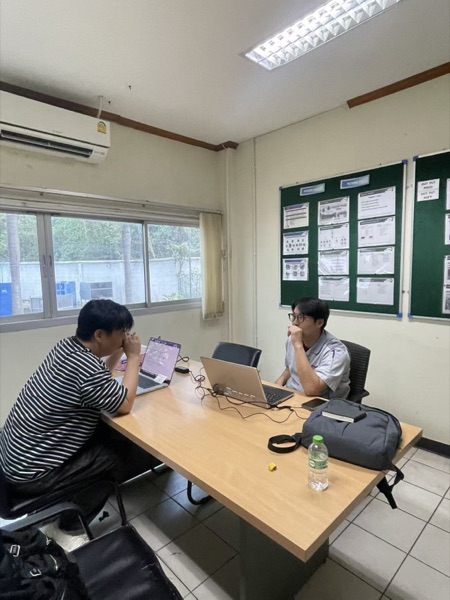
On the Ground — Partner Factories & Client Meetings

Direct visits to SEA manufacturing partners, supply chain verification, client meetings & partnership building

Direct factory verification · Client visits · Partnership building — Real business, not just slides

WHY NOW

Why Invest Now

① Platform Turning Point

11 years offline → 2026.01 official launch
Q1: 59 deals closed, repurchase 70-80%
“It works” just proven = cheapest entry point

② AI Era Starting Point

25,000+ real transaction data + RAG AI engine
Competitor data = 0
Must widen the gap now

③ Network Effect Critical Mass

2026: 120 co. (seed)
2027: 250 co. (critical mass)
Pre-critical mass investment = maximum returns

Why This Team Is Hard to Find

✓ China 10 years (NHN Accommate, GMV $117M)
✓ SEA 11 years (iMarket, peak revenue THB 267M)
✓ Simultaneous AI + Trade + Logistics + Production experience

✓ 5 entities in 4 countries already operating
✓ 2 patents registered, 5 additional filings planned
✓ 25,000+ real transaction data held

→ A team with this combination does not exist in the market

Pre-money $9~11M · With AI premium $17.7~26.5M (future upside)

VALUATION

Valuation

NTM (Next Twelve Months) — Based on projected revenue at 2027 breakeven, applying B2B SaaS median multiples

2027 Projected Revenue (NTM)
$1.77M
Breakeven point
Applied Multiple (B2B SaaS Median)
PSR 5.2-6.3x
Premium not included
Valuation (Pre-money)
$9-11M
$1.77M × 5.2-6.3x

PSR 5.2-6.3x Supporting Rationale

#ItemValue
1B2B SaaS median PSR range5-8x
22024 Direct export record$0.66M (59 deals)
3GMV CAGR (2026→2030)~176%
4Proprietary data (11 years of real transactions)25,000+
5Platform switching cost (data lock-in)High
6TAM — Digital adoption <5%$108B+
7Multi-country corporate infrastructure4 Countries
AI Premium not included

Through SaaS platform transactions, B2B data naturally accumulates, and this data becomes the foundation for AI training.

With AI applied (PSR 10-15x)
$17.7-26.5M
Currently offered at $9-11M, not included

Data Flywheel
Transaction growth → Data accumulation
AI accuracy improvement
→ Customer value increase
More transactions (self-reinforcing cycle)

B2B SaaS median multiple applied · AI premium not included — Conservative NTM-based valuation $9-11M

CROSS-VERIFICATION

Cross-verification & Investment Proposal

Valuation verified through 2 independent methods

Cross-verification

1VC Method
2027 Revenue ~$1.77M × Mature multiple 10x = $17.7M
Discount rate 40%, 2-year discount: $17.7M ÷ (1.4)²
= ~$9.0M
2Comparable Company
Bizongo (B2B supply chain) PSR 18.3x
+ AI premium 30% = PSR 23.8x
2026 Revenue $0.4M × 23.8x
= ~$9.4M
✓ All verification results converge in the $9-11M range

Investment Proposal

Pre-money$9-11M
Investment Amount$345K
Post-money$9.3-11.3M
Investor Equity Stake3.0~3.7%

Group Capital Status (Based on 2026.03 exchange rate)

EntityCapitalUSD Equivalent
Korea (HQ)$225K~$225K
Thailand2,000,000 THB~$60K
ChinaCNY 1M~$140K
MalaysiaMin. capitalBusiness prep.
Total~$425K

VC Method · Comparable analysis — Independent verification confirms convergence in $9-11M range

INVESTMENT

Investment Utilization Plan

Desired Investment Amount
$345K
Investment Purpose
Platform completion · Customer acquisition · Global expansion preparation
40% 30% 20% 10%
Tech Development (DVRP · POP · AI)
Go-to-Market (Marketing & Sales)
Team Expansion (Hiring)
Operations & Legal

Key Milestones (12 Months Post-Investment)

1
Client Acquisition: 120+ paying clients (Buyer+Vendor+Forwarder combined)
2
Transaction Volume: Platform GMV $3.5M achieved
3
Platform Completion: DVRP & POP official launch & stabilization
4
AI Accuracy: Quote recommendation accuracy 90%+, document error detection 95%+ (measured monthly)
5
Global Readiness: Pilot projects started in at least 2 countries

40% of investment focused on tech development — 5 key milestones within 12 months

CALL TO ACTION

Together, building
the future of global
B2B trade

REINDEERS is not just software.
It is a paradigm shift where international trade,
logistics & POP are integrated as one,
and AI assists decision-making — next-gen B2B infrastructure.

Investment Inquiry

REINDEERS Inc.

We are looking for investors to
build the future of global B2B trade with us.

Through investment, we will together
seize the lead in SEA and global B2B trade platform markets.

“The AI transformation of the $130B SEA trade market.
11 years of real data, 6 proprietary platforms, 4-country operational infrastructure
— we are the only team with this technology and execution capability.
Now is the optimal time to join us.”

Platform URLs11 Services
REINDEERSwww.reindeers.com
VENDORSvendor.reindeers.com
FORWARDERforwarder.reindeers.com
DVRPdvrp.reindeers.com
POPpop.reindeers.com
Document AIdai.reindeers.com
Workflow AIworkflow.reindeers.com
Businessbusiness.reindeers.com
Corpcorp.reindeers.com
Blogblog.reindeers.com
IRir.reindeers.com
REINDEERS 2026 | Designing the Future of Trade with AI — Trade, Logistics & Production as One, from SEA to Global